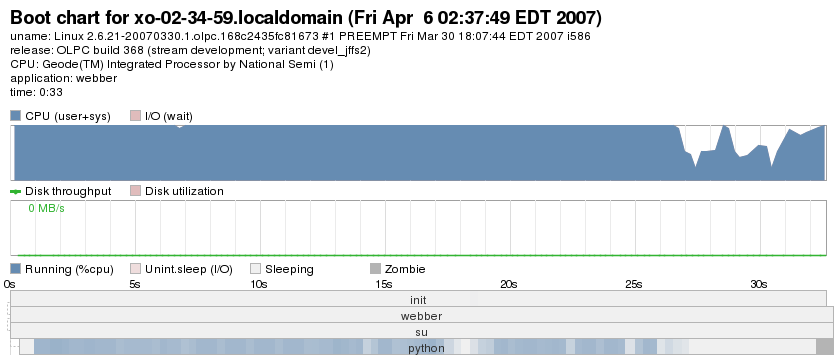
Bootchart example
Bootchart Example on OLPC
One would like to get an idea of what processes running on the system, what the processes are doing. Bootchart (http://www.bootchart.org/) is a program that logs that data and can produce a graph showing: the life times of the processes, the parents of the processes, and the kind of activity that each process has, the overall cpu activity, and overall file system activity.
The oplc development images have the bootchart-logger installed. Bootchart can record data about the the Web browser activity (from startup to shutdown) with the simple command run as root:
/sbin/bootchartd start /root/webber
The file webber is a simple executable with the following contents:
#!/bin/bash
su olpc -c 'sugar-activity Web'
When the Web activity is exited, the data is stored in /var/log/bootchart.tgz
The /var/log/bootchart.tgz can be transferred over to another more capable machine to generate the graphical image. The data can be rendered with:
bootchart -f png bootchart.tgz
This yields something like the following graph.
This shows that the start up is processor lmited. It would be useful to analyze this with OProfile or the python profiler to see where the processor is spending its time.
