Analyze: Difference between revisions
m (→Using Analyze) |
|||
| Line 19: | Line 19: | ||
=== Network Status interface === |
=== Network Status interface === |
||
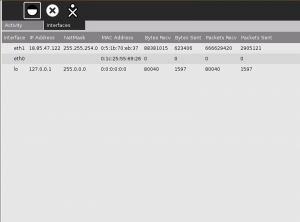
This interface displays network interface data from /proc/net/dev. You should see the following information: |
|||
The Network S |
|||
* interface name |
|||
* IP address |
|||
* netmask |
|||
* MAC address |
|||
* bytes received |
|||
* bytes sent |
|||
* packets received |
|||
* packets sent |
|||
[[Image:Analyze-activity-screenshot-network.png|300px|Networking interface screenshot]] |
[[Image:Analyze-activity-screenshot-network.png|300px|Networking interface screenshot]] |
||
=== X Window interface === |
=== X Window interface === |
||
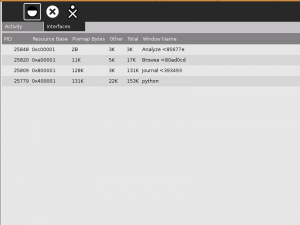
This interface displays X window information from the libXres extension. You should see the following information: |
|||
* X window names |
|||
* PIDs |
|||
* resource base |
|||
* pixmap bytes |
|||
* memory usage (other/total) |
|||
[[Image:Analyze-activity-screenshot-x.png|300px|X Window interface screenshot]] |
[[Image:Analyze-activity-screenshot-x.png|300px|X Window interface screenshot]] |
||
| Line 29: | Line 46: | ||
=== Presence Service interface === |
=== Presence Service interface === |
||
| ⚫ | |||
| ⚫ | |||
| ⚫ | |||
[[Image:Analyze-activity-screenshot-resize.png|200px]] |
[[Image:Analyze-activity-screenshot-resize.png|200px]] |
||
This interface has 3 sections: the presence service event log, Activities (on your Neighborhood) and Buddies (in your Neighborhood). |
|||
==== Presence service event log ==== |
|||
The top section of the Presence Service interface is a log of recent presence service events. |
|||
==== Activities (on your Neighborhood) ==== |
|||
The middle section of the Presence Service interface is a list of shared Activities visible in Neighborhood view, with the following information for each: |
|||
* object path |
|||
* ID |
|||
* color |
|||
* type |
|||
* name |
|||
* connection |
|||
* channels |
|||
* buddies |
|||
==== Buddies (in your Neighborhood) ==== |
|||
The middle section of the Presence Service interface is a list of shared Activities visible in Neighborhood view, with the following information for each: |
|||
* object path |
|||
* pubkey |
|||
* nick |
|||
* owner |
|||
* color |
|||
* IPv4 |
|||
* current activity |
|||
* Activities |
|||
* handles |
|||
| ⚫ | |||
== Semantic metadata == |
== Semantic metadata == |
||
Revision as of 19:23, 22 October 2008
What is Analyze?
Analyze is an Activity that displays your XO's networking, X (graphical) display, and presence service status. It is useful to developers and end-users as an easy way for users to monitor and submit data for monitoring/debugging networking/X issues.
Installing Analyze
See the section on installing Activities.
Using Analyze
Analyze is a very simple Activity. All that you do is tell it what interface you want it to display information from.
To select an interface, click on the "Interfaces" tab at top, and then on the appropriate Interface icon (by default, Analyze will start in the Network Status screen). Here are (from left to right) the Network Status, X Server, and Presence Service interface icons.
Network Status interface
This interface displays network interface data from /proc/net/dev. You should see the following information:
- interface name
- IP address
- netmask
- MAC address
- bytes received
- bytes sent
- packets received
- packets sent
X Window interface
This interface displays X window information from the libXres extension. You should see the following information:
- X window names
- PIDs
- resource base
- pixmap bytes
- memory usage (other/total)
Presence Service interface
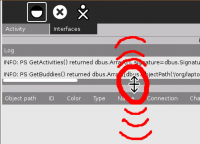
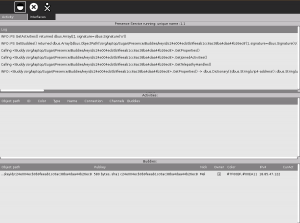
This interface displays Presence Service information, getting data directly from Dbus. Note that the Presence Service screen has 3 windows. You can drag the window boundaries up and down to resize the area of each sub-display.
This interface has 3 sections: the presence service event log, Activities (on your Neighborhood) and Buddies (in your Neighborhood).
Presence service event log
The top section of the Presence Service interface is a log of recent presence service events.
Activities (on your Neighborhood)
The middle section of the Presence Service interface is a list of shared Activities visible in Neighborhood view, with the following information for each:
- object path
- ID
- color
- type
- name
- connection
- channels
- buddies
Buddies (in your Neighborhood)
The middle section of the Presence Service interface is a list of shared Activities visible in Neighborhood view, with the following information for each:
- object path
- pubkey
- nick
- owner
- color
- IPv4
- current activity
- Activities
- handles
Semantic metadata
Activity Summary
| Icon: | Sugar icon::Image:Activity-analyze.svg |
| Genre: | Activity genre::Other |
| Activity group: | ,|x|Activity group::x}} |
| Short description: | [[Short description::Analyze is an Activity that displays your XO's networking, X (graphical) display, and presence service status. It is useful to developers and end-users as an easy way for users to monitor and submit data for monitoring/debugging networking/X issues.]] |
| Description: | [[Description::Analyze displays the following information in an easy-to-read format:
|
| Maintainers: | ,|x|Contact person::x}} |
| Repository URL: | Source code::http://dev.laptop.org/git?p=projects/analyze-activity |
| Available languages: | ,|x|Available languages::x}} |
| Available languages (codes): | ,|x|Language code::x}} |
| Pootle URL: | |
| Related projects: | Related projects,|x|Related projects::x}} |
| Contributors: | ,|x|Team member::x}} |
| URL from which to download the latest .xo bundle | Activity bundle::http://dev.laptop.org/~cscott/bundles/Analyze-7.xo |
| Last tested version number: | Activity version::7 |
| The releases with which this version of the activity has been tested. | ,|x|Software release::x}} |
| Development status: | Devel status::6. Mature |
| Ready for testing (development has progressed to the point where testers should try it out): | ,|x|Ready for testing::x}} |
| smoke tested : | |
| test plan available : | |
| test plan executed : | |
| developer response to testing : |


