MapStats/MobilePhonesLesson
This Mobiles/Cellphones Lesson helps students with concepts in statistics. The MapStats activity can be used to present many different statistics, so this guide should be helpful if they make their own maps and reports.
In this lesson, students learn
- using units in statistics
- the use of "density" and "per capita"
- understanding comparisons with statistics
- uses of different statistics
Using Units
The most important part of a statistic, or numerical fact, is not the number itself. The most important part is the units used.
You don't want to mistake meters and feet, or kilograms and pounds.
There are more units than metric and American/English. Suppose you went into a baker shop in each country and asked the price of a loaf of bread. You would get very different numbers, because one country may ask for pesos, another for yen, and another for dollars. To compare different countries, you must put their statistics into the same units.
In MapStats, be sure to check the units before writing down a number.
Density and per Capita
Density
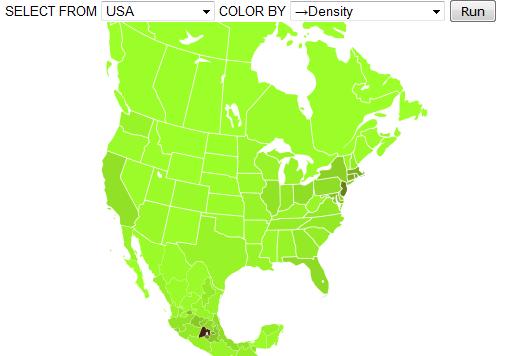
How many people live in a square kilometer? This statistic is known as population density. When you take a number and divide it by area, this gives you an idea of how many are in each part. A city would have a very high population density (because many people are in a small area) and a farm with one family on it would have a very small population density.
This map shows population density in North America. The most dense sections are around Mexico City and the northeast USA.

per Capita
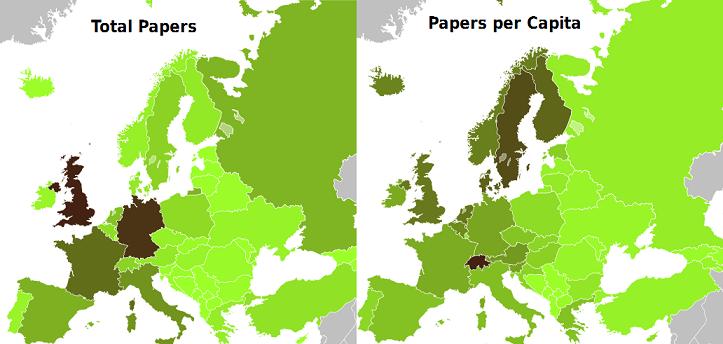
How many scientific papers are published in Germany each year? The number is very high, but Germany also has many people living there. To compare countries with different populations, you often use the "per person" number. You find this number by taking the country's total and dividing by population. This is the "per capita" measurement.
The map on the right shows that Switzerland has the most scientific papers per capita in Europe. How does a smaller country make so many scientific papers per person? The famous CERN laboratory in Switzerland has scientists from around the world, and Switzerland also has a good education system and many universities.
Comparing with statistics
Different uses
The MapStats activity contains three different numbers for mobiles (cell phones). There is the total number in the country, the mobile density, and the mobiles per capita.
Which statistic is the "right" one? It depends on what you are trying to find out.
Suppose you are working at a factory. You are asked to make a new mobile for Europe. By looking at the total number of mobiles in each country, you can see how many customers there are in each country. You see there are many customers in the United Kingdom and France, so you make sure that English and French people like the phone. There are not many customers in a small country such as Andorra, so it might not be part of your company's decisions.
Now suppose you have changed jobs to a cell phone tower planner. A cell phone tower makes radio contact with all of the cell phones in its area. In cities, where there are many phones, you will place a tower that can handle many phones. When you build a cell phone tower in a small town, there will not be as many phones in its area. You want to study "density".
Now suppose your friend wants help using cell phones to close the Digital Divide. She asks how many people in Nepal have cell phones. You tell her that there are more than a million mobile users, but this is 1 out of 25 Nepali people. This means that very few people in Nepal have their own mobile phone. By using a "per capita" measurement, you can see how popular phones are in Nepal. The number, 1/25 per capita, can be used to compare popularity with other countries with different numbers of people.
