Monitoring System Load
About
- Resources are limited: the less load an activity needs, the better!
- Best time to start monitoring the system load is during development; it's easy!
- Pygame best-practices are shown Game development HOWTO here and discussed here
Tools
- Monitoring System Load
- Monitor a single process
- pw.py .. a tool originating from olpc-austria
htop
installation:
$ su
# yum install htop
htop reacts on mouse-clicks - especially useful since the f-keys for the options are not working on the xo.
Process view: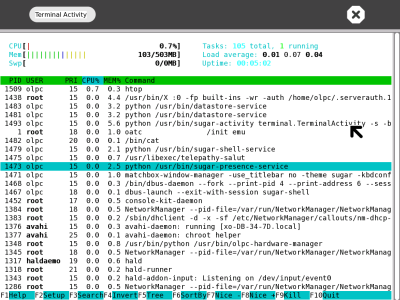 | XO-friendly setup: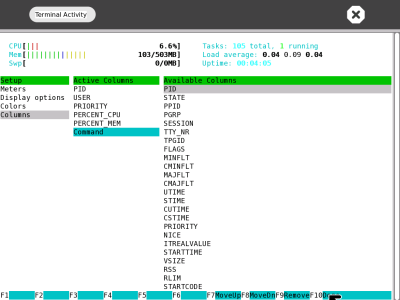 |
pw.py
- pw.py is a free and simple tool to monitor a single process with its cpu and memory load
- Source (GPL) [3 files]: tar.gz zip tree
- Existing plugins:
- pw-plugin-console.py ....... Console text output (cpu < 0.4%)
- pw-plugin-gtk_graph.py ... a simple graph with gtk (cpu < 1.3%)
- Planned plugins:
- pw-plugin-rrd-collect.py ... collect data for rrd and send over network
- pw-plugin-rrd_tool.py ...... receive data and draw graph with rrd
- Feedback: chris (at) linuxuser (dot) at
- Usage:
pw.py process_id/name/part_of_name
Examples:
  1. 'pw.py fire' ... possibly capture firefox
  2. 'pw.py 8285' ... watch process with pid 8285
  3. 'pw.py pw.py' .. watch last pw.py
- Screenshots:
Monitoring Firefox: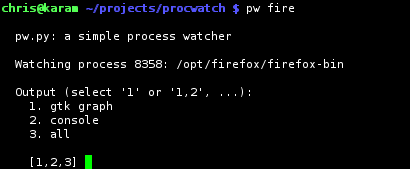 | GTK Graph (mem=grey, cpu=white):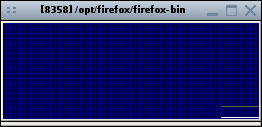 |
Capturing the Journal: 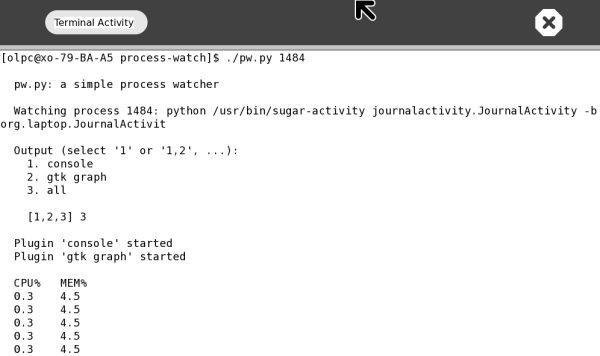 | |
Another Graph on the xo: 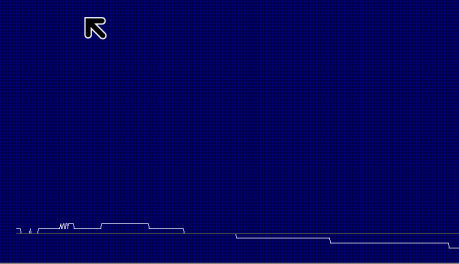 | |