Calculate: Difference between revisions
Jump to navigation
Jump to search
for other calculator activities, see calculation
| Line 31: | Line 31: | ||
2)Then move to the next line down and Put in the amount of the Variable. |
2)Then move to the next line down and Put in the amount of the Variable. |
||
3)Push the enter button (On computer Screen) |
3)Push the enter button (On computer Screen) |
||
* Plot Example |
|||
* The plot function takes two arguments |
|||
* The form is plot(function,variables) |
|||
Ex. plot(x^2,x=-2..2) |
|||
This will plot the line y=x^2 from x = -2 to 2 |
|||
The graph does not show increment |
|||
* The Sin Fuction Example |
|||
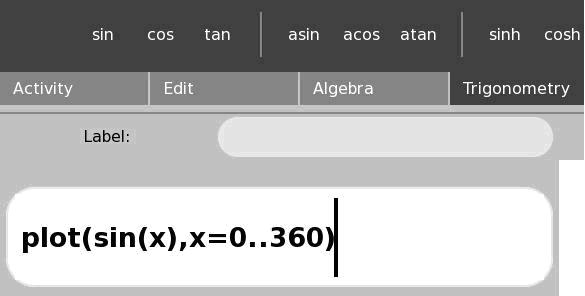
1) Type: plot(sin(x),x=0..360) in the input box. |
|||
[[Image:Plottest.jpg|Test of Sin Function]] |
|||
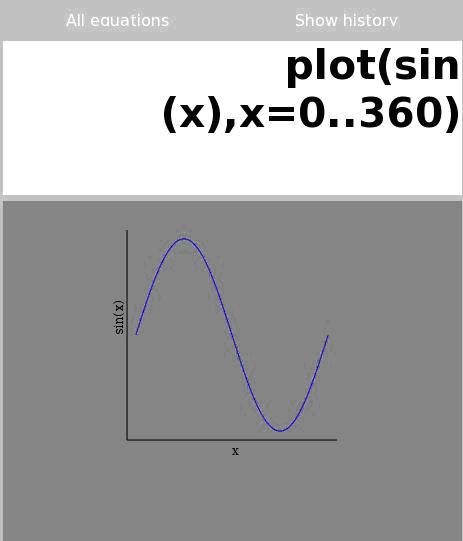
2)Click enter and on your right side there should be a graph of the sine function. |
|||
[[Image:PlotShow.jpg|Graph of Sin Function]] |
|||
===Beginning Documentation=== |
===Beginning Documentation=== |
||
Revision as of 00:50, 9 April 2008
This page is part of Math on the XO project.
see more templates or propose new |
Description & Goals
Summary
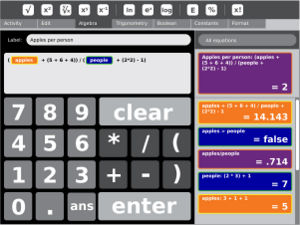
The calculate activity provides a generic calculator. The interface provides the simplest functions directly and should therefore be easy to use for the youngest children. However, it does support more complicated math and variables.
Goals
Teach children some math
Collaboration
Basic collaboration is functioning. The history box shows equations entered by buddies in their own color.
Functionality
- Variables: type 'apples:5' (and tab-completion of variable names)
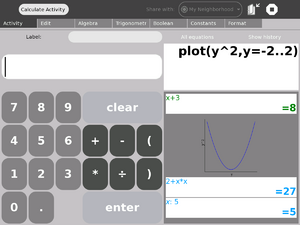
- Function plotting: type 'plot(sin(x),x=0..360)'
- To add Variables
   1)Type the name of the Variable in the Label box.
   2)Then move to the next line down and Put in the amount of the Variable.
   3)Push the enter button (On computer Screen)
- Plot Example
- The plot function takes two arguments
- The form is plot(function,variables)
   Ex. plot(x^2,x=-2..2)
   This will plot the line y=x^2 from x = -2 to 2
   The graph does not show increment
- The Sin Fuction Example
1) Type: plot(sin(x),x=0..360) in the input box.
2)Click enter and on your right side there should be a graph of the sine function.
Beginning Documentation
- Start-Up:
   1)  After pressing the Power button, the main boot screen will begin to load
   2)  After XO is completely booted, bring the mouse pointer down to the task bar at the bottom
       of the screen.
   3)  Arrow over until Calculate is highlighted
   4)  Select Calculate
   5)  Allow to Activity page to load
- Calculate Basic Functions:
   When Calculate is fully loaded this is the first screen you see is the Activity Page.
  The options consist of…
   1)  Edit
   2)  Algebra
   3)  Trigonometry
   4)  Boolean
   5)  Constants
   6)  Format
Basic calculation: Each of the buttons on the calculator are interactive and the calculator works the same as a normal calculator.
Calculator Function Tabs
- Edit:
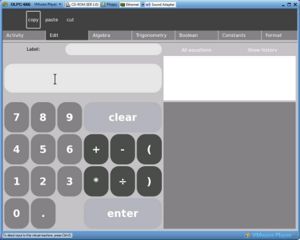
   Click Edit
   Simple editing options located on top of page.
   1) Copy: Highlight item then click Copy to Copy the information.
   2) Paste:  After the information has been copied, select this to paste it to where you would like
   3) Cut:  Cut removes the selected information from the screen and allows you to place it elsewhere.
   These Copy, Paste, and Cut functions can be used to take a previously used function and paste it
   back into the calculator.
- Algebra:
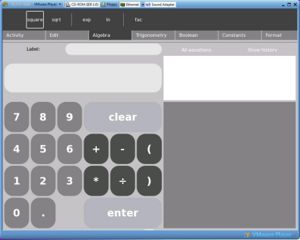
   Algebraic functions are displayed across the top bar
   1) Square:  Multiplies the result by itself
      Ex:  solution = 2  (Hit ‘square’ button) = 4
   2) Sqrt:  Short for Square Root, takes square root of a value.
   3) Exp:  Allows you to raise a value to an exponent that is different then 2.
   4) ln: Takes the Natural Log of a variable.
   5) Fac: Factorial function allows the user to take the factorial of the answer displayed.
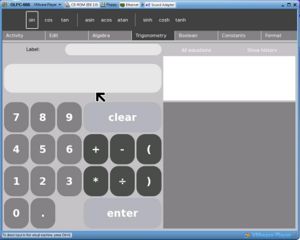
- Trigonometry:
   -Common Trigonometric functions listed with Hyperbolic and Inverse Trig functions
   1) Sin:  Enter a value and select sin to show the sin of the value.
   2) Cos:  Enter a value and select cos to show the cos of the value.
   3) Tan:  Enter a value and select tan to show the tan of the value.
   4) asin: Arcsin- Click asin to take the Arc Sin of the value displayed
   5) acos: Arccos- Click acos to take the Arc Cosine of the value displayed
   6) atan: Arctan- Click atan to take the Arc Tangent of the value displayed
   Hyperbolic Functions
       1) sinh
       2) cosh
       3) tanh
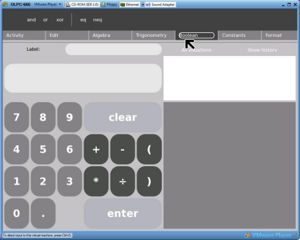
- Boolean:
   -Setup Boolean variables in this tab, choices consist of-
   1) And: sets up Boolean value ‘and’.
   2) Or:  sets up Boolean value ‘or’.
   3) Xor:  sets up Boolean value ‘xor’.
   4) Eq:  Use to create equality between variables.
   5) Neg: Use to negate a certain variable
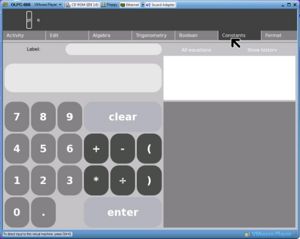
- Constants:
   -Constant values are displayed across the top of the page. Select Pi or e.
   1) Pi: Select for the decimal of Pi.
   2) e: constant commonly used in calculus
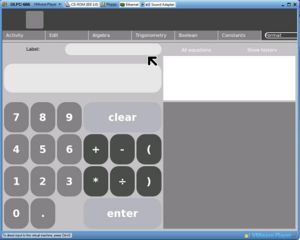
- Format:
To Be added...
Visual Design
Screenshots
Development
Feature Requests
Implementation Discussion
Version History
Source
RPMs
- none available


