Wireless Rate Adaptation Logic: Difference between revisions
(New page: One important adaptive behavior of a wireless station relates to the transmission rate it uses to send frames to a given neighbor. Most devices will try to use the highest rate possible, i...) |
No edit summary |
||
| Line 1: | Line 1: | ||
| ⚫ | |||
One important adaptive behavior of a wireless station relates to the transmission rate it uses to send frames to a given neighbor. Most devices will try to use the highest rate possible, i.e. the one by which it can successfully deliver the frame to its destination. The higher the data rate the more susceptible to interference it is and, because of this, distance and high transmission rate are opposing goals. |
One important adaptive behavior of a wireless station relates to the transmission rate it uses to send frames to a given neighbor. Most devices will try to use the highest rate possible, i.e. the one by which it can successfully deliver the frame to its destination. The higher the data rate the more susceptible to interference it is and, because of this, distance and high transmission rate are opposing goals. |
||
| Line 8: | Line 11: | ||
In this case, three nodes are used. The first, “A” pings the second “B” while a contending traffic generated by “C” is switched on and off. This contending traffic is an UDP flow that will vary its throughput throughout the experiment. We repeat the experiment with the rate adaptation logic off and the transmission rates fixed at 54Mbps. |
In this case, three nodes are used. The first, “A” pings the second “B” while a contending traffic generated by “C” is switched on and off. This contending traffic is an UDP flow that will vary its throughput throughout the experiment. We repeat the experiment with the rate adaptation logic off and the transmission rates fixed at 54Mbps. |
||
[[Image:Rate logic1.png]] |
|||
| ⚫ | |||
| ⚫ | |||
[figure] |
|||
39 |
|||
| ⚫ | |||
As expected results with the rate adaptation logic off were clearly superior, with the rate of retries dropping from 9% to 4% and the delivery rate improving 1% (Figure 1). Figure 2 shows how the rate adaptation logic can increase airtime consumption by decreasing transmission rates. In this case, the contending traffic on node “C” was activated after 8 seconds and at about 19 seconds, collisions led the rate adaptation mechanism to decrease rates, which caused the harmful feedback (collision causes the lowering of rates that causes more collisions) peaking to more than 2% of airtime consumption – twenty times the normal. |
As expected results with the rate adaptation logic off were clearly superior, with the rate of retries dropping from 9% to 4% and the delivery rate improving 1% (Figure 1). Figure 2 shows how the rate adaptation logic can increase airtime consumption by decreasing transmission rates. In this case, the contending traffic on node “C” was activated after 8 seconds and at about 19 seconds, collisions led the rate adaptation mechanism to decrease rates, which caused the harmful feedback (collision causes the lowering of rates that causes more collisions) peaking to more than 2% of airtime consumption – twenty times the normal. |
||
Similar results are shown in Figure 3 where the increase in retransmissions result in peaks of latency that can reach up to 400ms, against less than 3ms for a transmission that is successful at the first attempt. |
Similar results are shown in Figure 3 where the increase in retransmissions result in peaks of latency that can reach up to 400ms, against less than 3ms for a transmission that is successful at the first attempt. |
||
[[Image:Rate logic2.png]] |
|||
[figure] |
|||
| ⚫ | |||
40 |
|||
[[Image:Rate logic3.png]] |
|||
| ⚫ | |||
| ⚫ | |||
[figure] |
|||
41 |
|||
| ⚫ | |||
Figure 4 shows the effects on airtime consumed by the ping traffic, as the CBR is switched on and off with different intervals between datagrams (100ms, 50ms and 10ms) and, once again, shows that whenever the contending source reaches a certain throughput, the collisions will cause the rate adaptation to react. The consolidation interval for this graph is one second, and this explains why the peaks are lower than the ones presented in Figure 2 where the consolidation interval was 100 milliseconds. |
Figure 4 shows the effects on airtime consumed by the ping traffic, as the CBR is switched on and off with different intervals between datagrams (100ms, 50ms and 10ms) and, once again, shows that whenever the contending source reaches a certain throughput, the collisions will cause the rate adaptation to react. The consolidation interval for this graph is one second, and this explains why the peaks are lower than the ones presented in Figure 2 where the consolidation interval was 100 milliseconds. |
||
[[Image:Rate logic4.png]] |
|||
[figure] |
|||
| ⚫ | |||
42 |
|||
| ⚫ | |||
Revision as of 23:09, 11 August 2008
One important adaptive behavior of a wireless station relates to the transmission rate it uses to send frames to a given neighbor. Most devices will try to use the highest rate possible, i.e. the one by which it can successfully deliver the frame to its destination. The higher the data rate the more susceptible to interference it is and, because of this, distance and high transmission rate are opposing goals.
Due to limited memory resources the XO implement a simple Frame Error Rate algorithm that lower the transmission rate if a given number of consecutive frames are lost and, likewise, raises that rate if a given number of consecutive frames are successfully sent.
The problem with that scheme lies exactly on the idea of reacting to a failed transmission. For 802.11 every unicast frame must be acknowledge and if a transmitting node does not receive the correspondent ack, it will consider the frame lost and retransmit it. But this method draws no distinction between a frame that was lost due to poor link quality and a frame that was lost due to a congested scenario, where both the frame and the ack have a higher probability of colliding.
When a node reacts to a congested scenario by lowering the transmission range it is actually making things even worse. The following experiment was designed to demonstrate that this is exactly the case for the XO rate adaptation logic. In this case, three nodes are used. The first, “A” pings the second “B” while a contending traffic generated by “C” is switched on and off. This contending traffic is an UDP flow that will vary its throughput throughout the experiment. We repeat the experiment with the rate adaptation logic off and the transmission rates fixed at 54Mbps.
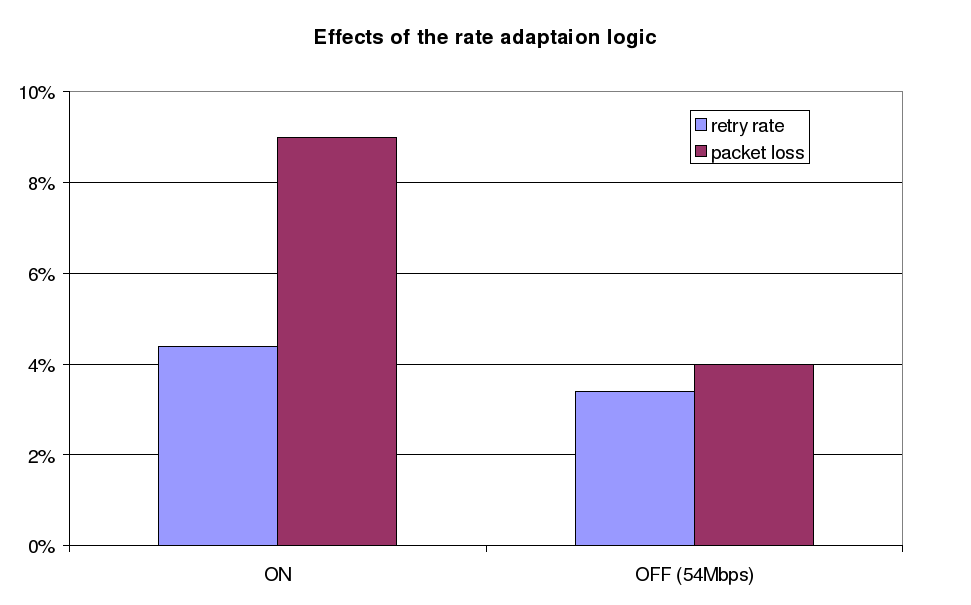
Figure 1 – Packet loss and retry rate for the rate adaptation logic enabled (ON) and disabled (OFF – with the rate fixed at 54Mbps).
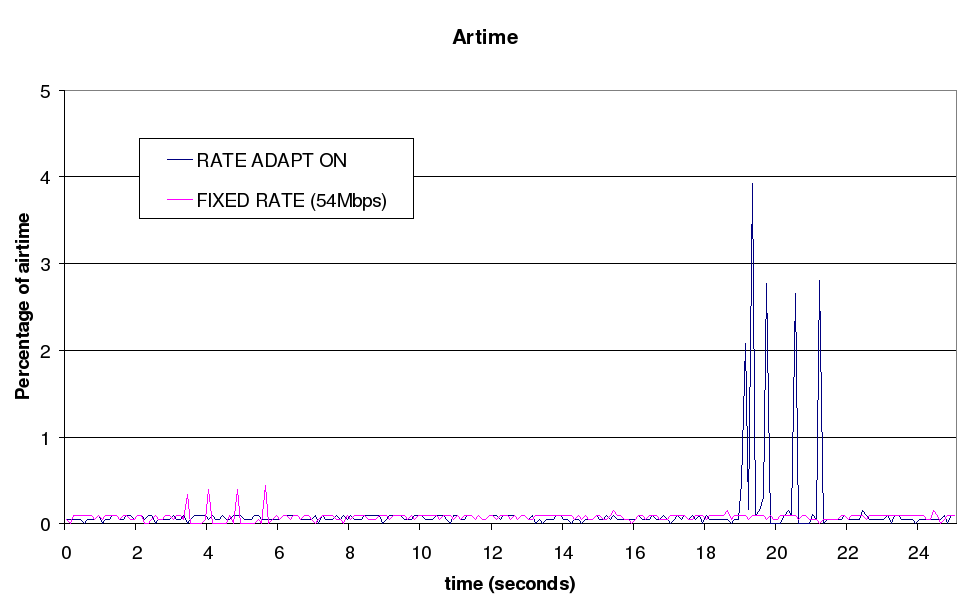
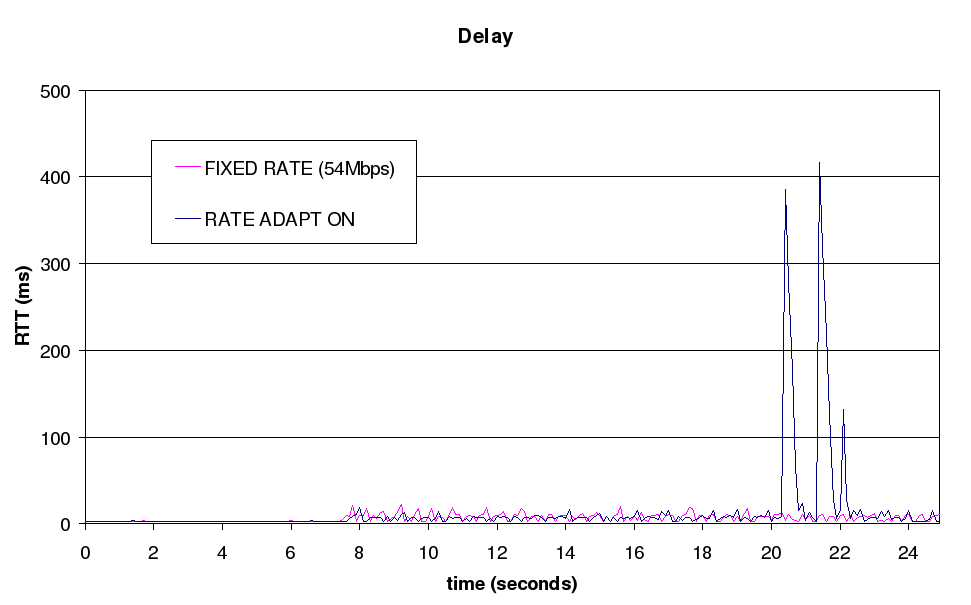
As expected results with the rate adaptation logic off were clearly superior, with the rate of retries dropping from 9% to 4% and the delivery rate improving 1% (Figure 1). Figure 2 shows how the rate adaptation logic can increase airtime consumption by decreasing transmission rates. In this case, the contending traffic on node “C” was activated after 8 seconds and at about 19 seconds, collisions led the rate adaptation mechanism to decrease rates, which caused the harmful feedback (collision causes the lowering of rates that causes more collisions) peaking to more than 2% of airtime consumption – twenty times the normal. Similar results are shown in Figure 3 where the increase in retransmissions result in peaks of latency that can reach up to 400ms, against less than 3ms for a transmission that is successful at the first attempt.
 Figure 2 – Peaks in airtime consumption of the icmp traffic due to the rate adaptation logic.
 Figure 3 – Peaks in RTT for the icmp traffic due to the adaptation logic.
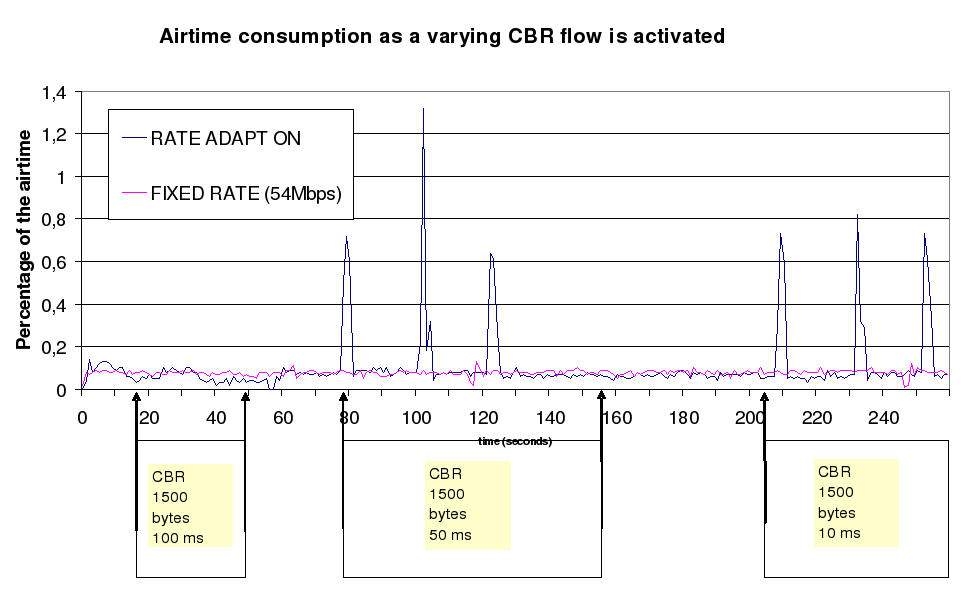
Figure 4 shows the effects on airtime consumed by the ping traffic, as the CBR is switched on and off with different intervals between datagrams (100ms, 50ms and 10ms) and, once again, shows that whenever the contending source reaches a certain throughput, the collisions will cause the rate adaptation to react. The consolidation interval for this graph is one second, and this explains why the peaks are lower than the ones presented in Figure 2 where the consolidation interval was 100 milliseconds.
 Figure 4 – As the CBR is switched on and off the rate adaptation logic reacts wrongly, pottentially congesting the network.
