User:Ndoiron/SocialCalc/Mongolian: Difference between revisions
| (16 intermediate revisions by 5 users not shown) | |||
| Line 1: | Line 1: | ||
[[SocialCalc]] үйл ажиллагаанд диаграм нэмэлт. Download: http://sugo-katta.appspot.com/SocialCalcMN.xo |
|||
Charting additions to the [[SocialCalc]] Activity. |
|||
Firefox вэб хөтөчөөр шалга [http://andrew.cmu.edu/user/ndoiron/socialCalc/index.html here] |
|||
==Бүх төрлийн диаграммд зориулав.== |
|||
* 1) Мөр баганыг сонгон идэвхижүүлэх |
|||
* 2) '''Граф''' сонгох |
|||
* 3) Графикийн хэлбэр(Graph Type)сонгох |
|||
* 4) '''OK''' товш |
|||
==Тэгш өнцөгт диаграм== |
|||
==For all Charts== |
|||
Ялгаатай утгуудыг харьцуулахад тэгш өнцөгт хүснэгтийг ашиглана. |
|||
* 1) Select a row or column of numbers |
|||
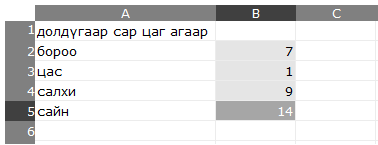
Амьтадын амьдрах хугацааг харьцуулсан тэгш өнцөгт диаграм байгуулах жишээ: |
|||
* 2) Click the '''Graph''' tab |
|||
* 1) Амьтадын нэрийн жагсаалт үүсгэх |
|||
* 3) Select a graph type |
|||
* 2) Баруун гар талд нь амьдрах хугацааг хийх |
|||
* 4) Click the '''OK''' button |
|||
* 3) Тоонуудын жагсаалтыг идэвхижүүлэн товш |
|||
Continue reading for examples of each chart type. |
|||
==Bar Charts== |
|||
You can use a bar chart to compare different values to each other. |
|||
For example, you can make a bar chart that compares the lifespan of different animals. |
|||
* 1) Make a list of animals |
|||
* 2) To the right, make a list of animals' lifespans |
|||
* 3) Click and drag to highlight the list of numbers |
|||
[[Image:Barchart1M.png]] |
[[Image:Barchart1M.png]] |
||
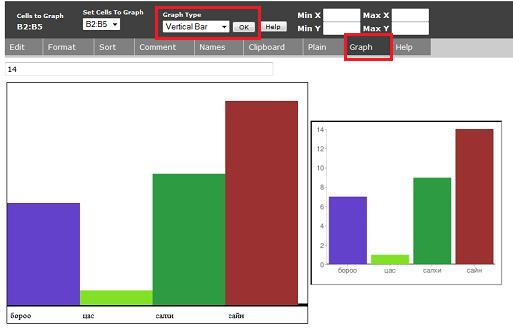
'''Graph''' цэсний Тэгш өнцөгт Граф type-ийг идэвхижүүлэн OK товш. |
|||
Click the '''Graph''' tab, select the '''Vertical Bar Chart''' type, then click OK. |
|||
Диаграмын өнгө солиходоо '''Graph''' товш эсвэл дахин OK товш. |
|||
'''Click Graph or OK again to change the colors in the chart''' |
|||
[[Image:Barchart2M.png]] |
[[Image:Barchart2M.png]] |
||
Мөн ижил тэгш өнцөгт диаграмыг өөр байрлалд бий болгоно. |
|||
Also try the '''Horizontal Bar Chart''' type - which works the same way but has bars in a different direction: |
|||
==Дугуй диаграм== |
|||
==Pie Charts== |
|||
Бүхэл хэсгийн хувь хэмжээг харьцуулахдаа дугуй диаграм ашиглана. |
|||
You can use a pie chart to compare fractions making up the whole. |
|||
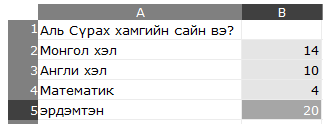
Дуртай хичэээлийнх нь талаар санал хураахад хүмүүс хэрхэн хуваагдаж буйг харуулах дугуй диаграм байгуулах жишээг үзүүлэв. |
|||
* 1) Хичээлүүдийн нэрсийн жагсаалт хийх |
|||
For example, you can make a pie chart that shows how people divided for a vote on their favorite class. |
|||
* 2) Хичээлийн нэрсийн баруун талд санал өгсөн хүмүүсийн тоог тавих |
|||
* 1) Make a list of classes |
|||
* 3) Тоонуудын жагсаалтыг идэвхижүүлэн товш |
|||
* 2) To the right, put a count of how many people voted for that class |
|||
* 3) Click and drag to highlight the list of numbers |
|||
[[Image:Piechart1M.png]] |
[[Image:Piechart1M.png]] |
||
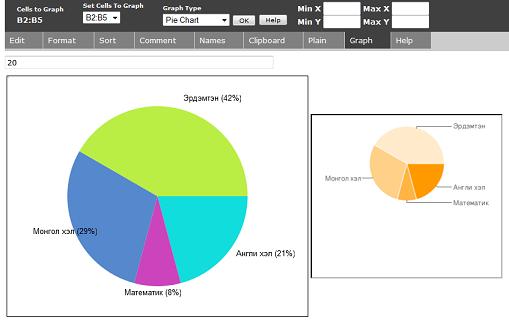
'''Граф''' цэснээс Дугуй хэлбэр сонгон '''OK''' товш. |
|||
Click the '''Graph''' tab, select the '''Pie Chart''' type, then click OK. |
|||
Өнгийг сонгохдоо '''Граф''' эсвэл '''OK''' товш. |
|||
'''Click Graph or OK again to change the chart colors.''' |
|||
[[Image:Piechart2M.png]] |
[[Image:Piechart2M.png]] |
||
==Шугаман диаграм== |
|||
==Line Charts== |
|||
Хоёр хувьсагчийн хоорондын харилцан хамаарлыг үзүүлэх, хугацааны янз бүрийн утгын тоонуудыг харьцуулах, хугацааны өөрчлөлт дэх утгыг харуулахд шугаман диаграм хэрэглэнэ. |
|||
You can use a line chart to see a value change over time, compare multiple values over time, or show the relationship between any two variables. |
|||
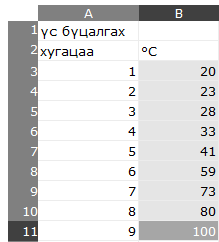
Усны буцлах хүртлэх үеийн температурыг хугацаанаас хамааруулах шугаман диаграм байгуулах жишээг үзүүлэв. |
|||
* 1) Хугацааны жагсаалт үүсгэх |
|||
For example, you can make a line chart showing how temperature of water changes as it is heated. |
|||
* 2) Баруун талд нь температурын харгалзах жагсаалтуудыг үүсгэх |
|||
* 1) Make a list of times (they do not need to be equally spaced) |
|||
* 3) Баруун баганын тоонуудын жагсаалтыг идэвхижүүлэн товш |
|||
* 2) To the right, make a list of temperatures |
|||
* 3) Click and drag to highlight the list of numbers in the right column |
|||
[[Image:Linechart1M.png]] |
[[Image:Linechart1M.png]] |
||
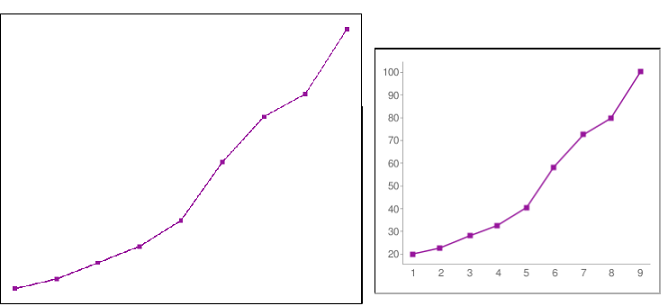
'''Граф''' цэс товшиж,'''Шугаман''' хэлбэрийг сонгон '''OK''' товш. |
|||
[[Image:Linechart2M.png]] |
[[Image:Linechart2M.png]] |
||
Эдгээр диаграм нь хугацаа болон температурын утгатайгаар болон утга харагдахгүйгээр байна.[[Image:Linechart5.png]] |
|||
Without a list of x-values in the left column, the points will be placed at [0,1,2,3...) |
|||
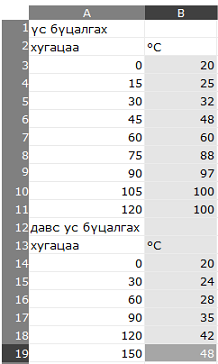
Мөн нэг хувьсагчаар шугаман диаграм байгуулж болно. Эхний жагсаалтын доор хоёрдугаар тоонуудын жагсаалт нэмэх буюу '''Edit''' цэс дээр товш. |
|||
[[Image:Linechart5.png]] |
|||
Ус ба сүү халаах үеийн температурыг үзүүлсэн жишээг үзүүлэв. |
|||
You can also make a line chart with more than one line (more than one data set). Click on the '''Edit''' tab and add a second list of numbers below the first list. |
|||
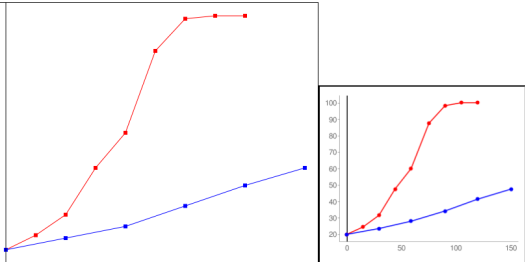
This example shows the temperature of a block over time. The experiment with this block takes longer and is measured at different intervals. |
|||
[[Image:Linechart3M.png]] |
[[Image:Linechart3M.png]] |
||
Тоо утгуудын баганыг бүгдийг идэвхижүүлэн '''Граф''' сонгон '''OK''' товш. |
|||
Select the entire column of numbers, press the '''Graph''' tab, and click '''OK'''. |
|||
[[Image:Linechart4.png]] |
[[Image:Linechart4.png]] |
||
Дараагийн Х утга нь одоо байгаагаасаа бага байх үед SocialCalc нь хоёрдогч шугамыг зурдаг. Хэрвээ та (1,0)-ээс (2,0)-руу, мөн (3,1)-ээс (4,1)-рүү шугам зурж байгаа бол эхлээд (3,1)-ээс (4,1)-рүү баруун шугамыг жагсаах хэрэгтэй болно. |
|||
SocialCalc draws a second line when the next X value is less than the current one. If you were graphing a line from (1,0) to (2,0) and a line from (3,1) to (4,1) you would need to list the rightmost line - (3,1) to (4,1) - first. |
|||
==Талбайд тархаах диаграм== |
|||
====Graph Window==== |
|||
Та хоёр хувьсагчийн (эсвэл 3) хоорондох холболтыг харуулах тараасан диаграмыг хэрэглэж чадна. Тараасан диаграмын цэгүүд холбогддоггүй гэдгээрээ шугаман графикаас ялгаатай байдаг. Та хэдэн туршилтуудаас үр дүнг оруулах, мөн тэд шугамш бөөгнөрөл эсвэл бусад загваруудыг бүрэлдүүлдэг бол тайланг харж чадна. |
|||
The line chart will set the window to fit your data. You can set the window yourself (X Min, X Max, Y Min, Y Max) in the textboxes above the chart. For example, you can set Y Min to zero so that the X-axis is visible in your chart. |
|||
Энэ нь суралцагчдын дүнгийн шинжилгээ болон хэдэн цаг суралцаж байгааг үзүүлдэг. Суралцагчид илүү төвшинд сайжран суралцдаг. |
|||
Clicking '''OK''' resets the window, and clicking '''Graph''' will change line colors without changing the window. |
|||
[[Image:Linechart6.png]] |
|||
==Scatter Plots== |
|||
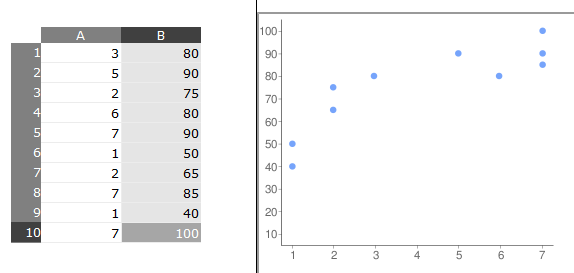
You can use a scatter plot to show the connection between two (or even three) variables. Unlike the line chart, a scatter plot does not connect its dots. You can include results from several experiments and reports to see if they form a line, a cluster, or have other patterns. |
|||
This sample scatter plot shows test scores of several students based on how many hours they had studied. It shows that students that studied more tended to get better scores. |
|||
[[Image:Scatterchart1.png]] |
[[Image:Scatterchart1.png]] |
||
Шинэ багананд график дээр цэг бүрийн хэмжээг та тохируулж чадна. Бусад утгууд нь Google диаграм дээр гарч ирдэггүй. |
|||
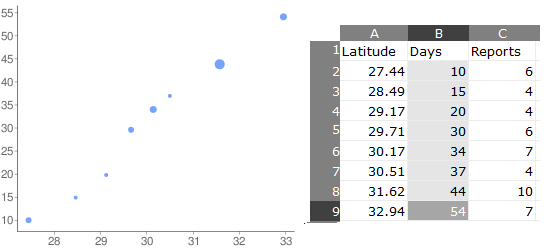
You can set the size of each dot on the chart, either to highlight their importance or to include a third variable. The following example uses the X and Y dimensions to compare reports of new spring flowers blooming days (time from Jan 1) by latitude (distance from the equator). The size of the dot (put in a new column to the right) shows the number of reports made. |
|||
Use dot sizes from 0.5 to 10.0 for best results. Other values will not appear on the Google chart. |
|||
[[Image:Scatterchart2.png]] |
[[Image:Scatterchart2.png]] |
||
==Graph Window== |
|||
Шугаман диаграм болон тараасан диаграмууд нь ялгаагүй өгөгдлөө цуглуулах цонх суурилуулсан. Диаграмынхаа дээр бичвэр бичих хэсэгт (X Min, X Max, Y Min, Y Max)гэсэн цонхнуудыг суулгасан. Жишээлбэл та Y Min-г тэг болголоо гэхэд диаграм дээр нь X тэнхлэг л харагддаг. |
|||
The scatter chart, like the line chart, will set the window to fit your data. You can set the window yourself (X Min, X Max, Y Min, Y Max) in the textboxes above the chart. For example, you can set Y Min to zero so that the X-axis is visible in your chart. |
|||
Clicking '''OK''' resets the window, and clicking '''Graph''' will change line colors without changing the window. |
|||
==Using Charts in Reports== |
|||
Now that you have a chart, you can use either chart in Write, Paint, or other activities. |
|||
'''Google Charts''' |
|||
* 1) Press the Frame button to make it appear |
|||
* 2) Click and drag the chart image, then drop it in the lower-left corner |
|||
* 3) Click and drag the image out of the frame and into Write, Paint, or another activity |
|||
'''Other Charts''' |
|||
* 1) Press the alt and 1 keys |
|||
* 2) Go to the Journal activity and put your mouse over the Screenshot image entry |
|||
* 3) Select Copy |
|||
* 4) Click and drag the image out of the frame and into Write, Paint, or another activity |
|||
Here you have a chart included in a report about a class project: |
|||
[[Image:Usedchart.png]] |
|||
==Which Chart Type Do I Use?== |
|||
When you are working on a report, think about what type of chart is good for the data. |
|||
For example, the ages of animals works well in the bar chart example. You could make a pie chart with the same numbers, but there is no reason to include ages of different animals in the same circle. Only make a pie chart if you are comparing parts of the whole. |
|||
Votes can be compared to each other in either a bar chart or a pie chart. The pie chart shows values with fractions, while the bar chart shows values stacked next to each other. |
|||
Line charts are good for showing change over time - the changing data can be a number like population, temperature, heart rate, or speed. Time can be on the y-axis for some experiments. For example, you could measure the time for a pendulum to swing for several different lengths of the pendulum. You would put the lengths of pendulums in the left column and the times on the right side. The numbers on the right column should depend on changes in the left column's value. |
|||
==Lesson Ideas== |
|||
* Ask students to write down the day's weather (sun, clouds, rain, snow) for 7-30 days. At the end, help students include a bar chart or pie chart in their results. |
|||
* Complete an experiment measuring the temperature of water as it cools or heats. Use a line chart to measure the change in temperature over time |
|||
* Have students exercise until their heart is beating quickly, then sit down. Use a heart rate monitor or have the student count the number of beats in a 10-second period to measure heart rate as they relax, until their heart is beating normally. Plot 3 students' results on the same line chart. |
|||
* Find census records with population of your city, state, or country. Use a line graph to measure the change in population over several years. |
|||
* Have students each cast a vote for favorite singers, sports, or games. Have them create a pie chart showing the results. |
|||
* Ask students to compare the population of several countries with a bar chart. You could also compare the numbers of pages in different books, the lengths of dinosaurs, or the weight of different objects. |
|||
==Programming Notes== |
|||
All necessary changes are made in the JavaScript of SocialCalcActivity.activity/web/index.html - download from [http://andrew.cmu.edu/user/ndoiron/socialCalc/index.html here] |
|||
The chart is generated twice, using the [http://en.wikipedia.org/wiki/Canvas_(HTML_element) HTML Canvas element] and the [http://code.google.com/apis/chart/ Google Charts API]. This allows users to view charts while offline, with the more professional chart images possible with an internet connection. |
|||
When programming the Canvas element, use deprecated Mozilla-specific code such as mozDrawText and mozTextStyle - newer methods like fillText are not supported by the laptop. |
|||
Цонх оруулах бол '''OK''' товш. Мөн шугамны өнгө өөрчлөх гэх мэтийн зүйлийг өөрчлөх бол '''Graph'''-ийг товш. |
|||
Teachers may be unaware of colorblind students' difficulty to read charts. At this time, chart colors are generated randomly for each computer, and students can reset the color as needed. If you are using a set of preset colors, please consider this color set: http://jfly.iam.u-tokyo.ac.jp/color/index.html#pallet |
|||
Latest revision as of 21:23, 18 June 2010
SocialCalc үйл ажиллагаанд диаграм нэмэлт. Download: http://sugo-katta.appspot.com/SocialCalcMN.xo
Firefox вэб хөтөчөөр шалга here
Бүх төрлийн диаграммд зориулав.
- 1) Мөр баганыг сонгон идэвхижүүлэх
- 2) Граф сонгох
- 3) Графикийн хэлбэр(Graph Type)сонгох
- 4) OK товш
Тэгш өнцөгт диаграм
Ялгаатай утгуудыг харьцуулахад тэгш өнцөгт хүснэгтийг ашиглана. Амьтадын амьдрах хугацааг харьцуулсан тэгш өнцөгт диаграм байгуулах жишээ:
- 1) Амьтадын нэрийн жагсаалт үүсгэх
- 2) Баруун гар талд нь амьдрах хугацааг хийх
- 3) Тоонуудын жагсаалтыг идэвхижүүлэн товш
Graph цэсний Тэгш өнцөгт Граф type-ийг идэвхижүүлэн OK товш. Диаграмын өнгө солиходоо Graph товш эсвэл дахин OK товш.
Мөн ижил тэгш өнцөгт диаграмыг өөр байрлалд бий болгоно.
Дугуй диаграм
Бүхэл хэсгийн хувь хэмжээг харьцуулахдаа дугуй диаграм ашиглана. Дуртай хичэээлийнх нь талаар санал хураахад хүмүүс хэрхэн хуваагдаж буйг харуулах дугуй диаграм байгуулах жишээг үзүүлэв.
- 1) Хичээлүүдийн нэрсийн жагсаалт хийх
- 2) Хичээлийн нэрсийн баруун талд санал өгсөн хүмүүсийн тоог тавих
- 3) Тоонуудын жагсаалтыг идэвхижүүлэн товш
Граф цэснээс Дугуй хэлбэр сонгон OK товш. Өнгийг сонгохдоо Граф эсвэл OK товш.
Шугаман диаграм
Хоёр хувьсагчийн хоорондын харилцан хамаарлыг үзүүлэх, хугацааны янз бүрийн утгын тоонуудыг харьцуулах, хугацааны өөрчлөлт дэх утгыг харуулахд шугаман диаграм хэрэглэнэ. Усны буцлах хүртлэх үеийн температурыг хугацаанаас хамааруулах шугаман диаграм байгуулах жишээг үзүүлэв.
- 1) Хугацааны жагсаалт үүсгэх
- 2) Баруун талд нь температурын харгалзах жагсаалтуудыг үүсгэх
- 3) Баруун баганын тоонуудын жагсаалтыг идэвхижүүлэн товш
Граф цэс товшиж,Шугаман хэлбэрийг сонгон OK товш.
Эдгээр диаграм нь хугацаа болон температурын утгатайгаар болон утга харагдахгүйгээр байна.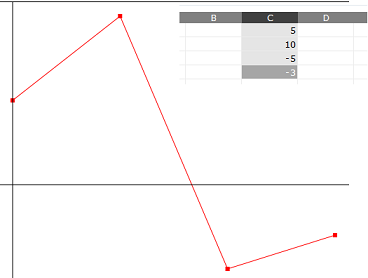
Мөн нэг хувьсагчаар шугаман диаграм байгуулж болно. Эхний жагсаалтын доор хоёрдугаар тоонуудын жагсаалт нэмэх буюу Edit цэс дээр товш. Ус ба сүү халаах үеийн температурыг үзүүлсэн жишээг үзүүлэв.
Тоо утгуудын баганыг бүгдийг идэвхижүүлэн Граф сонгон OK товш.
Дараагийн Х утга нь одоо байгаагаасаа бага байх үед SocialCalc нь хоёрдогч шугамыг зурдаг. Хэрвээ та (1,0)-ээс (2,0)-руу, мөн (3,1)-ээс (4,1)-рүү шугам зурж байгаа бол эхлээд (3,1)-ээс (4,1)-рүү баруун шугамыг жагсаах хэрэгтэй болно.
Талбайд тархаах диаграм
Та хоёр хувьсагчийн (эсвэл 3) хоорондох холболтыг харуулах тараасан диаграмыг хэрэглэж чадна. Тараасан диаграмын цэгүүд холбогддоггүй гэдгээрээ шугаман графикаас ялгаатай байдаг. Та хэдэн туршилтуудаас үр дүнг оруулах, мөн тэд шугамш бөөгнөрөл эсвэл бусад загваруудыг бүрэлдүүлдэг бол тайланг харж чадна. Энэ нь суралцагчдын дүнгийн шинжилгээ болон хэдэн цаг суралцаж байгааг үзүүлдэг. Суралцагчид илүү төвшинд сайжран суралцдаг.
Шинэ багананд график дээр цэг бүрийн хэмжээг та тохируулж чадна. Бусад утгууд нь Google диаграм дээр гарч ирдэггүй.
Graph Window
Шугаман диаграм болон тараасан диаграмууд нь ялгаагүй өгөгдлөө цуглуулах цонх суурилуулсан. Диаграмынхаа дээр бичвэр бичих хэсэгт (X Min, X Max, Y Min, Y Max)гэсэн цонхнуудыг суулгасан. Жишээлбэл та Y Min-г тэг болголоо гэхэд диаграм дээр нь X тэнхлэг л харагддаг.
Цонх оруулах бол OK товш. Мөн шугамны өнгө өөрчлөх гэх мэтийн зүйлийг өөрчлөх бол Graph-ийг товш.
