File:XO 1.5 A2 Tinderbox.png: Difference between revisions
Jump to navigation
Jump to search
(This is the power distribution diagram for an XO 1.5 A2 prototype. It shows the different locations where we are measuring power consumptions (through current measurements). See XO 1.5 A2 Tinderbox.) |
(uploaded a new version of "Image:XO 1.5 A2 Tinderbox.png") |
| (2 intermediate revisions by the same user not shown) | |
(No difference)
| |
Latest revision as of 15:45, 11 August 2009
This is the power distribution diagram for an XO 1.5 A2 prototype. It shows the different locations where we are measuring power consumptions (through current measurements). See XO 1.5 A2 Tinderbox.
File history
Click on a date/time to view the file as it appeared at that time.
| Date/Time | Thumbnail | Dimensions | User | Comment | |
|---|---|---|---|---|---|
| current | 15:45, 11 August 2009 | 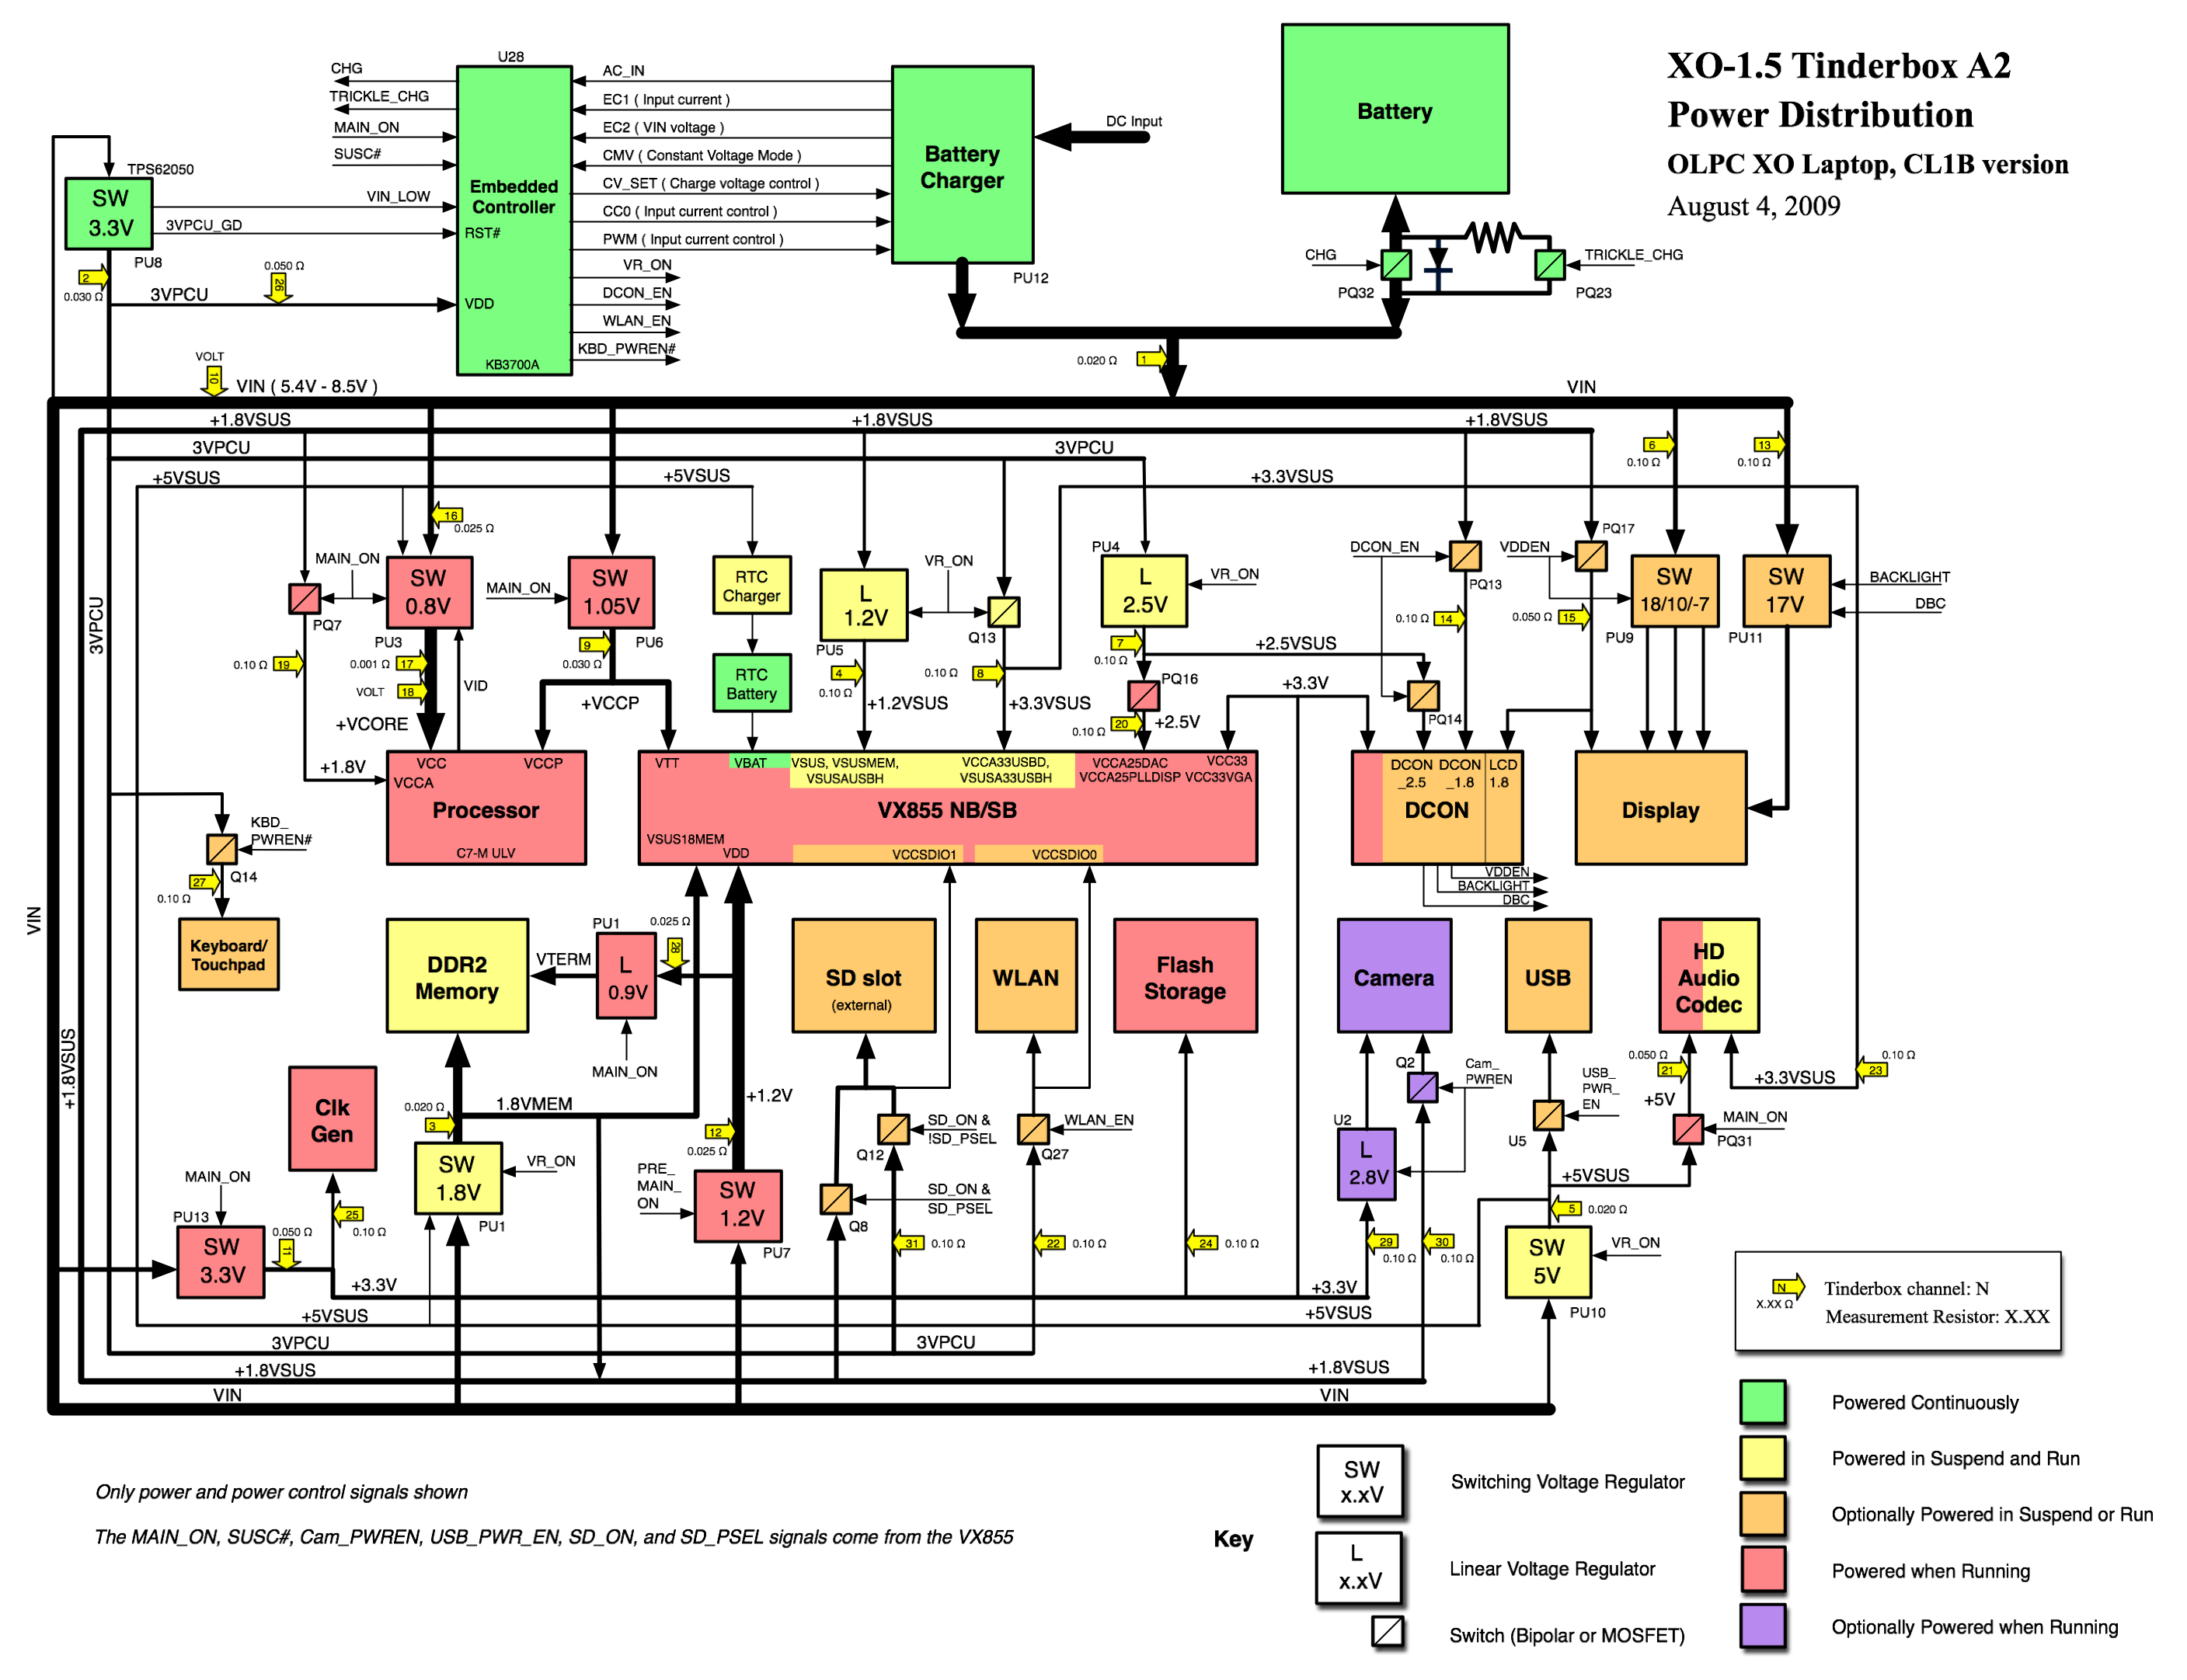 | 2,815 × 2,163 (771 KB) | Wad (talk | contribs) | |
| 05:43, 10 August 2009 |  | 2,815 × 2,135 (772 KB) | Wad (talk | contribs) | This is the power distribution diagram for an XO 1.5 A2 prototype. It shows the different locations where we are measuring power consumptions (through current measurements). See XO 1.5 A2 Tinderbox. | |
| 05:04, 10 August 2009 |  | 2,815 × 2,135 (767 KB) | Wad (talk | contribs) | This is the power distribution diagram for an XO 1.5 A2 prototype. It shows the different locations where we are measuring power consumptions (through current measurements). See XO 1.5 A2 Tinderbox. | |
| 04:56, 10 August 2009 |  | 2,815 × 2,135 (768 KB) | Wad (talk | contribs) | This is the power distribution diagram for an XO 1.5 A2 prototype. It shows the different locations where we are measuring power consumptions (through current measurements). See XO 1.5 A2 Tinderbox. |
File usage
The following page uses this file: