PyGTK/PyDebug Status Snapshot Oct 25 2009: Difference between revisions
No edit summary |
|||
| Line 14: | Line 14: | ||
I would love to figure out how to manipulate the PYTHONPATH to substitute for sugar.activity.activity my own shim which caused the debugee's main window to position itself on the correct page of my application. It seems likely that I can do this, but the first time I tried it, it didn't work. I don't know enough about module search order, sub-classing, etc. |
I would love to figure out how to manipulate the PYTHONPATH to substitute for sugar.activity.activity my own shim which caused the debugee's main window to position itself on the correct page of my application. It seems likely that I can do this, but the first time I tried it, it didn't work. I don't know enough about module search order, sub-classing, etc. |
||
[[Image:Your_Program_Output_Page.png]] |
[[Image:Your_Program_Output_Page.png]] |
||
==Flexible access to Journal, and the writeable directories from an Activity |
==Flexible access to Journal, and the writeable directories from an Activity== |
||
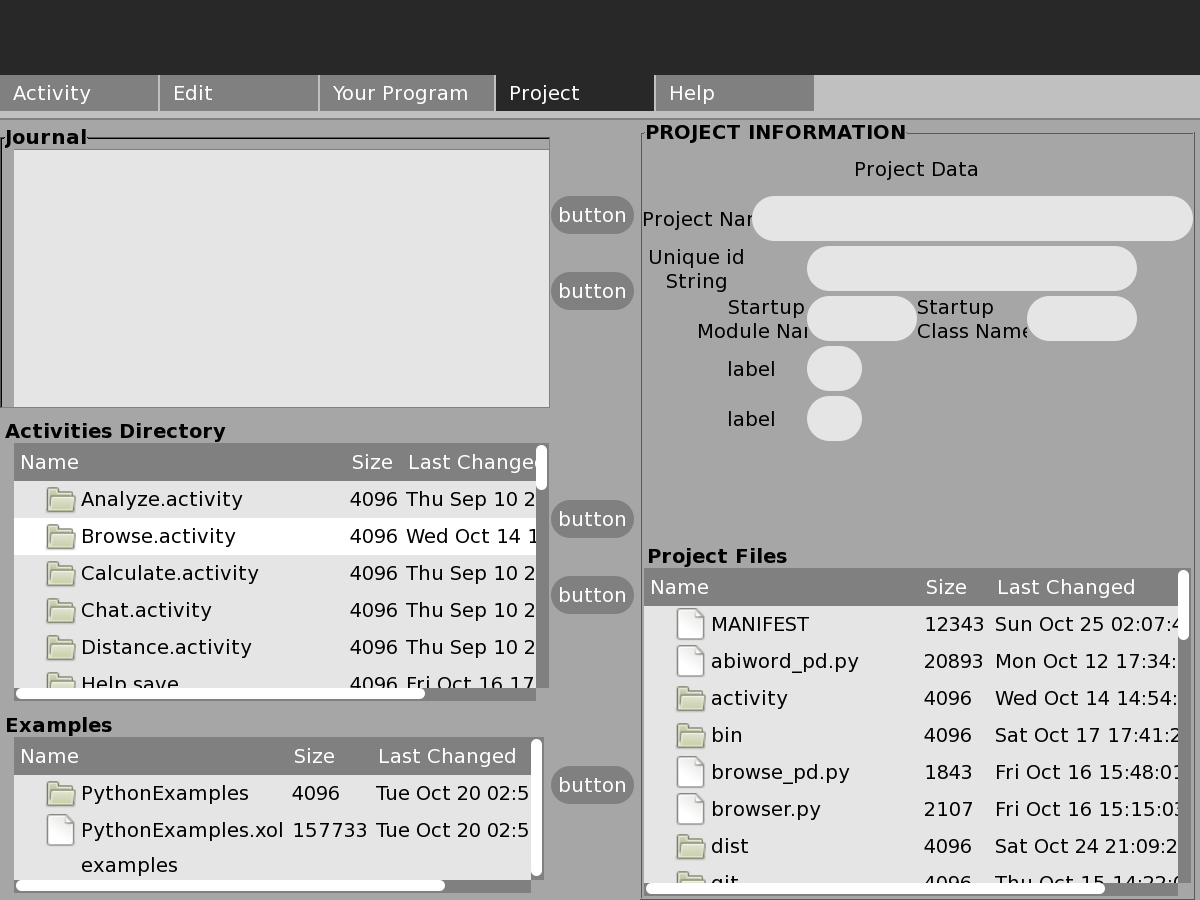
The Bitfrost, and isolation security measures limit the possiblilties for a debugger. At this point I have to recover the functionality for reading and writing the Journal, and generating and loading the zipped <Activity>-3.XO files which seemed to be working when I hade the Write activity integrated with the debugger. There's lots of grunt work getting the contents of the activity/activity.info file interfaced with the textboxes on the project side of the screen. And I need to find icons for left and right arrows for the Buttons. This portion of the application will need lots of testing, because it could really cause pain if it doesn't function correctly. |
The Bitfrost, and isolation security measures limit the possiblilties for a debugger. At this point I have to recover the functionality for reading and writing the Journal, and generating and loading the zipped <Activity>-3.XO files which seemed to be working when I hade the Write activity integrated with the debugger. There's lots of grunt work getting the contents of the activity/activity.info file interfaced with the textboxes on the project side of the screen. And I need to find icons for left and right arrows for the Buttons. This portion of the application will need lots of testing, because it could really cause pain if it doesn't function correctly. |
||
[[Image:Project_Page.png]] |
[[Image:Project_Page.png]] |
||
==Help== |
==Help== |
||
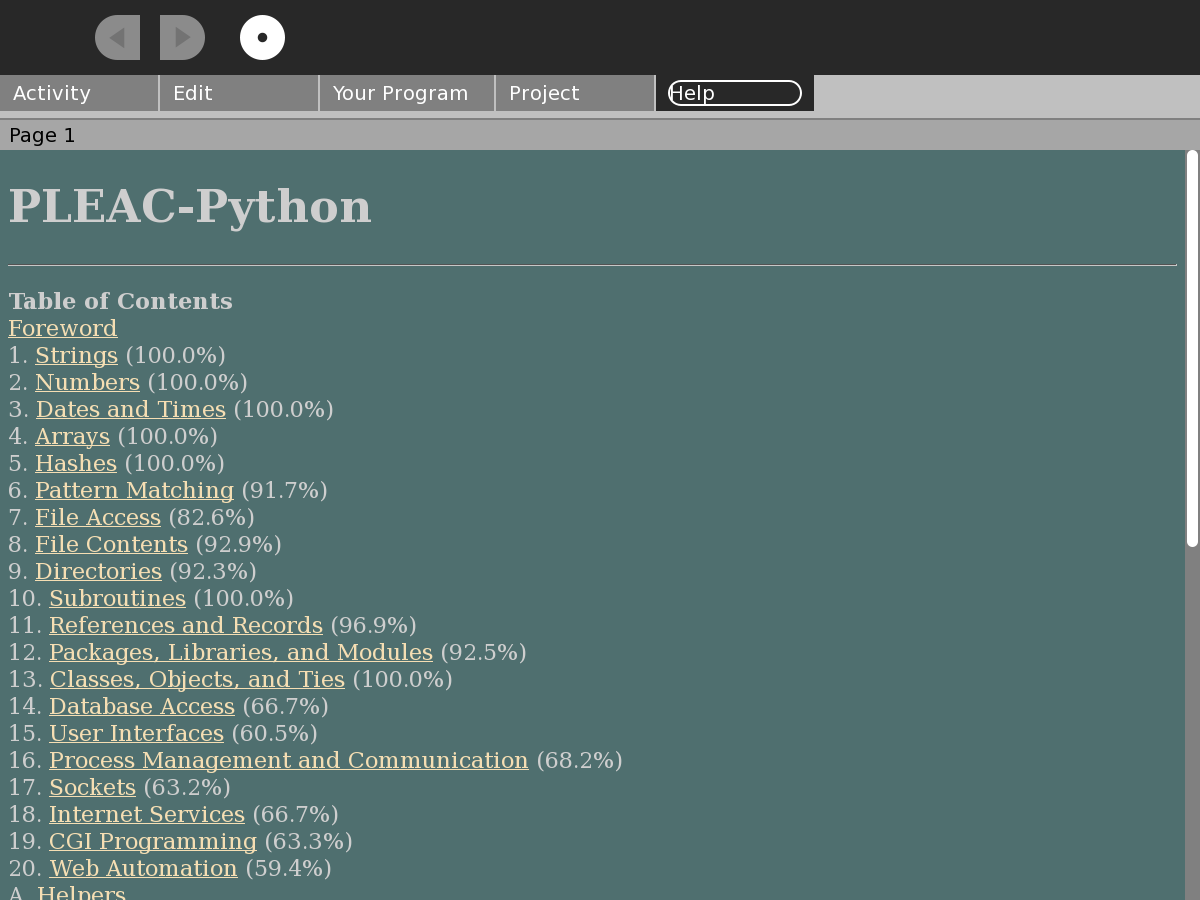
I started looking at providing a help engine that worked off of zipped html bundles. Ths screen is actually pulled out of such a zipped repository. But in order to function in the bitfrost environment, I needed to write the unzipped html to the activity_root/data directory. After the first file is unzipped, the gecko engine changes its "current context directory". Maybe the easiest in the short term is to give up on working from zipped bundles, or to unzip them completely at application installation. Identifying the best, most useful, tutorials, that have translations, seems important |
I started looking at providing a help engine that worked off of zipped html bundles. Ths screen is actually pulled out of such a zipped repository. But in order to function in the bitfrost environment, I needed to write the unzipped html to the activity_root/data directory. After the first file is unzipped, the gecko engine changes its "current context directory". Maybe the easiest in the short term is to give up on working from zipped bundles, or to unzip them completely at application installation. Identifying the best, most useful, tutorials, that have translations, seems important |
||
Latest revision as of 19:12, 25 October 2009
Lots of Progress, and Lots more to do
Everywhere I look, as I start playing with PyDebug, there are things that I don't know how to do, or things that I've chosen to defer because they don't seem central to my development effort. I'm writing this to clarify my thinking, identify the places where I need help, and to try to keep focused.
I'll use the following screenshots to focus on the problems/questions I'm currently stuck on:
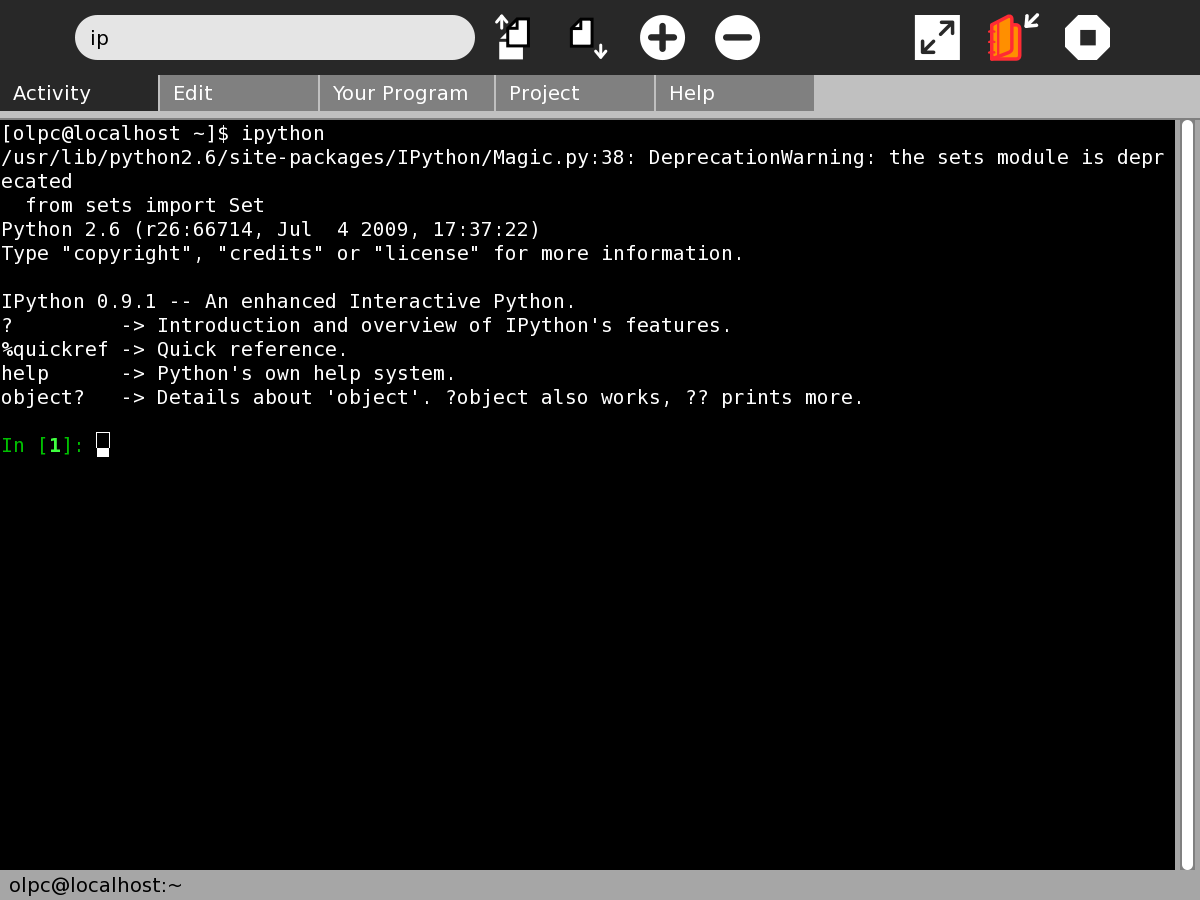 I've been experimenting with the rpyc package which bundles a lot of python awareness around a set of socket utilities. I was able to initiate a connection when I started a server in one process, and tried to connect to it with another process. But when I tried to use the glib.add_idle function to add a non-blocking socket to the GTK event loop, I was not able to successfully connect. Was the socket code that I tried to add to the GTK mainloop actually executed? Can I actually give a remote process (my debug application) access to the namespaces I am trying to debug.
A quick reading of the ipython documentation suggests that the -g commandline option will somehow help in compatibiliaty with GTK. I need to find someone who has experience with all the options in order to know how to proceed.
Programmer's Text Editor
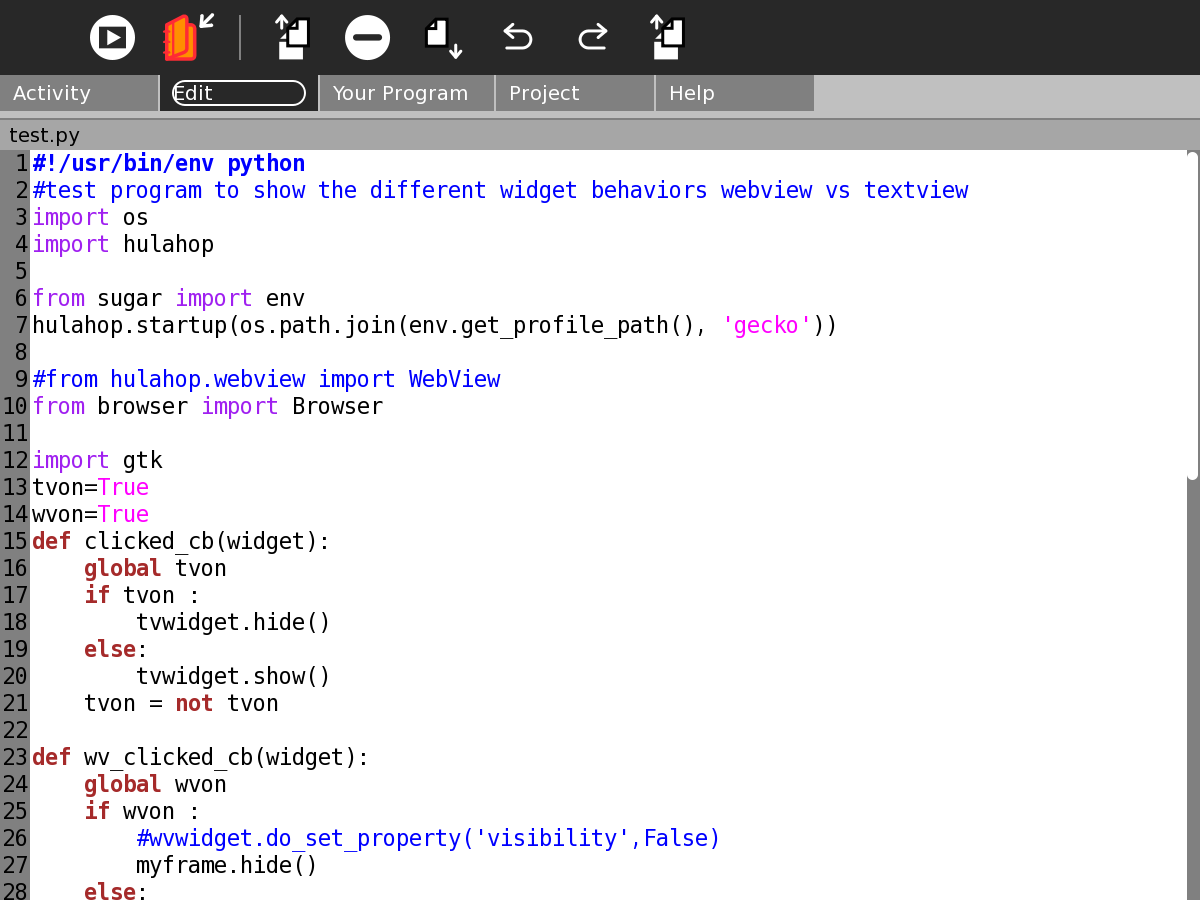
Following the advice I got from Ben, I swapped out Write in favor of Sourceview. It seems snappy and the python color coding and line numbering makes it a much more useful tool. The cut, paste, copy functions work from the keyboard without any intervention on my part. But when I add buttons, and create call back routines that intercept <ctrl>C,V,X, I need to manipulate the GTK clipboard myself. I didn't get it right the first time. Is there any way to emit <ctrl> codes from a button push without creating an endless loop, letting the compiled Sourceview code deal with it? I need to find out what help the Sourceview package provides for find and replace functions. I can create a glade dialog for controlling these functions.
Grabbing the Application's Main window and putting it in a Notebook Page
I would love to figure out how to manipulate the PYTHONPATH to substitute for sugar.activity.activity my own shim which caused the debugee's main window to position itself on the correct page of my application. It seems likely that I can do this, but the first time I tried it, it didn't work. I don't know enough about module search order, sub-classing, etc.
Flexible access to Journal, and the writeable directories from an Activity
The Bitfrost, and isolation security measures limit the possiblilties for a debugger. At this point I have to recover the functionality for reading and writing the Journal, and generating and loading the zipped <Activity>-3.XO files which seemed to be working when I hade the Write activity integrated with the debugger. There's lots of grunt work getting the contents of the activity/activity.info file interfaced with the textboxes on the project side of the screen. And I need to find icons for left and right arrows for the Buttons. This portion of the application will need lots of testing, because it could really cause pain if it doesn't function correctly.
Help
I started looking at providing a help engine that worked off of zipped html bundles. Ths screen is actually pulled out of such a zipped repository. But in order to function in the bitfrost environment, I needed to write the unzipped html to the activity_root/data directory. After the first file is unzipped, the gecko engine changes its "current context directory". Maybe the easiest in the short term is to give up on working from zipped bundles, or to unzip them completely at application installation. Identifying the best, most useful, tutorials, that have translations, seems important
