Measure/Kasiisi: Difference between revisions
(Created page with 'For [http://www.kasiisiproject.org/ The Kasiisi Project], I have modified the Measure activity for a class on environmental sensors for the XO-1. The program is posted and docume…') |
No edit summary |
||
| (5 intermediate revisions by the same user not shown) | |||
| Line 1: | Line 1: | ||
[[Image:MeasureMeasuring.png|300px]] |
|||
| ⚫ | |||
| ⚫ | |||
The activity will be downloadable and documented from this page. |
|||
Lesson plans from the project are available in [[User:Ndoiron/Out Of The Box|Out of the Box]] article. |
|||
==Measure Activity== |
==Measure Activity== |
||
| Line 6: | Line 12: | ||
==Differences== |
==Differences== |
||
===Simplicity=== |
===Simplicity=== |
||
* The activity |
* The activity opens with the Sensor toolbar and view open, instead of the Sound toolbar and view |
||
* Sensor input is converted to a readable number (Celsius or a light "percent") and displayed in real time. |
* Sensor input is converted to a readable number (Celsius or a light "percent") and displayed in real time. |
||
* The graph shows the last 3 to 5 seconds and gradually scrolls across the screen, so you can observe changes. For example, you can cover and uncover a light sensor and see the difference appear on the graph in real time. |
* The graph shows the last 3 to 5 seconds and gradually scrolls across the screen, so you can observe changes. For example, you can cover and uncover a light sensor and see the difference appear on the graph in real time. |
||
* The graph is flipped so that increases in temperature and light appear as a rise in the graph's value |
* The graph is scaled and flipped so that increases in temperature and light appear as a rise in the graph's value |
||
[[Image:TrackingSensor.jpg|300px]] |
|||
===Counter=== |
|||
A 'counter' is kept of how many times the circuit is completely open and completely closed (wires disconnected versus connected), so you can use it to count button pressed or to monitor very quick pulses from a sensor |
|||
===Sound=== |
|||
New buttons let you connect a sound to the circuit being completely opened or completely closed (wires disconnected versus connected), so you can make doors creak open, books protected by alarms, pointers that name items on posters, and many more sensors. |
|||
===Support for RFID=== |
===Support for RFID=== |
||
| ⚫ | |||
[[Image:OLPCandRFID.jpg|300px]] |
|||
| ⚫ | The Kasiisi |
||
| ⚫ | Students could also |
||
| ⚫ | |||
[[Image:RFIDworked.jpg|300px]] [[Image:TryingRFIDTags.jpg|300px]] |
|||
| ⚫ | The Kasiisi Project used RFID as a bridge between students' real-world artwork and digital information. For example a student would draw a gorilla and write a short webpage on gorillas (potentially including links, photos, and sounds). When the tag is scanned, the Measure activity identifies the tag and loads the student's page. |
||
| ⚫ | Students could also be tagging a sculpture/model, book, poster, or parts of a map. Tags can be re-used, and more tags can be bought at 25 cents to expand the library. When RFID tags become cheaper ("like dust", some predict) you can imagine connecting every book in a library and every place on a map to its digital counterpart through RFID tags. Any way you use RFID, it lets students create objects at the cutting-edge junction of real and virtual. |
||
==Adding Sensors== |
==Adding Sensors== |
||
===Just Add Aluminum Foil=== |
|||
| ⚫ | |||
[[Image:PliersSensor.jpg|300px]] [[Image:KasiisiDoorSensor.jpg|250px]] [[Image:PointerSensor.jpg|300px]] |
|||
It is easy to make the simplest sensors... just find ways to connect the two wires. Attaching one wire to a window frame and another to the shutters allowed us to sense when a window opened and closed. The aluminum foil helps us make a circuit with anything, even the pair of pliers above. Here are two more examples: |
|||
===Sensors from RadioShack / elsewhere=== |
|||
[[Image:AddingASensor.jpg|300px]] |
|||
With analog sensors, you just connect a wire to each end of a sensor and interact with it. [http://search.digikey.com/scripts/DkSearch/dksus.dll?KeyWords=317-1258-ND Temperature] and [http://search.digikey.com/scripts/DkSearch/dksus.dll?KeyWords=PDV-P9203-ND light] sensors from DigiKey work well. Similar sensors are available, for cheap, at RadioShack and at several websites online. |
|||
| ⚫ | |||
===More Complex Sensors=== |
|||
[[Image:SolarArduino.jpg|300px]] |
|||
If you want a 5-Volt power source or have a difficult-to-interpret sensor (RFID was a good example of this), it may help to use an Arduino. |
|||
===Sensor Values Onscreen=== |
|||
Edit drawwaveform.py to add more sensors |
Edit drawwaveform.py to add more sensors and write numbers to the pango layout form (where Temperature and Light values are displayed). |
||
Latest revision as of 01:01, 26 August 2010
For The Kasiisi Project, I have modified the Measure activity for a class on environmental sensors for the XO (untested on XO 1.5).
The activity will be downloadable and documented from this page.
Lesson plans from the project are available in Out of the Box article.
Measure Activity
Read more about Measure to learn more about what the activity is useful for, and what sensors have been applied to it.
Differences
Simplicity
- The activity opens with the Sensor toolbar and view open, instead of the Sound toolbar and view
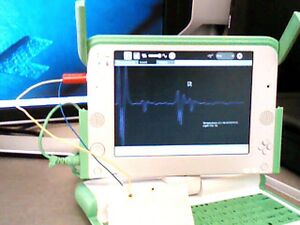
- Sensor input is converted to a readable number (Celsius or a light "percent") and displayed in real time.
- The graph shows the last 3 to 5 seconds and gradually scrolls across the screen, so you can observe changes. For example, you can cover and uncover a light sensor and see the difference appear on the graph in real time.
- The graph is scaled and flipped so that increases in temperature and light appear as a rise in the graph's value
Counter
A 'counter' is kept of how many times the circuit is completely open and completely closed (wires disconnected versus connected), so you can use it to count button pressed or to monitor very quick pulses from a sensor
Sound
New buttons let you connect a sound to the circuit being completely opened or completely closed (wires disconnected versus connected), so you can make doors creak open, books protected by alarms, pointers that name items on posters, and many more sensors.
Support for RFID
RFID is essentially a radio barcode. A tag the size of a quarter is placed on or inside an object. When that object passes within a few inches of an RFID reader, its code is automatically scanned. These tags are used worldwide to track animals, encode passports, and take inventory.
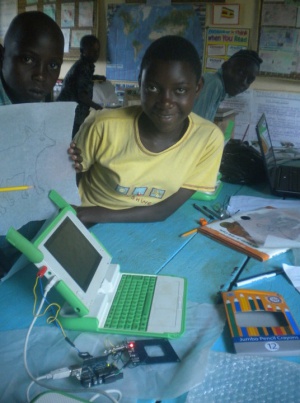
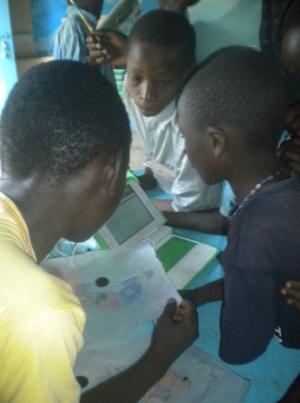
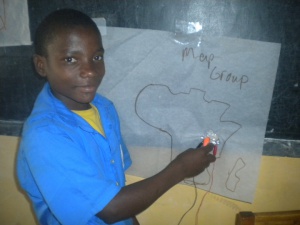
The Kasiisi Project used RFID as a bridge between students' real-world artwork and digital information. For example a student would draw a gorilla and write a short webpage on gorillas (potentially including links, photos, and sounds). When the tag is scanned, the Measure activity identifies the tag and loads the student's page.
Students could also be tagging a sculpture/model, book, poster, or parts of a map. Tags can be re-used, and more tags can be bought at 25 cents to expand the library. When RFID tags become cheaper ("like dust", some predict) you can imagine connecting every book in a library and every place on a map to its digital counterpart through RFID tags. Any way you use RFID, it lets students create objects at the cutting-edge junction of real and virtual.
Adding Sensors
Just Add Aluminum Foil
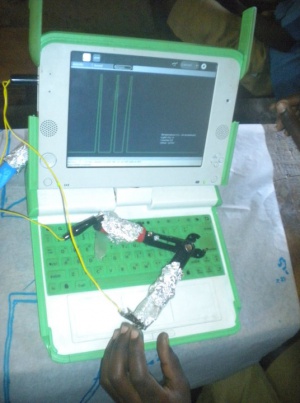
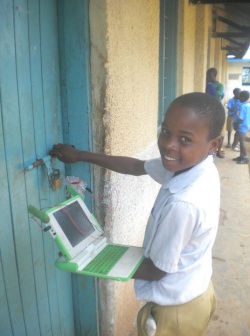
It is easy to make the simplest sensors... just find ways to connect the two wires. Attaching one wire to a window frame and another to the shutters allowed us to sense when a window opened and closed. The aluminum foil helps us make a circuit with anything, even the pair of pliers above. Here are two more examples:
Sensors from RadioShack / elsewhere
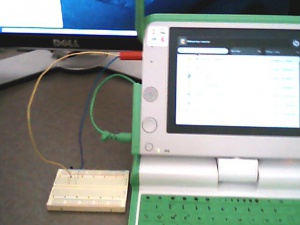
With analog sensors, you just connect a wire to each end of a sensor and interact with it. Temperature and light sensors from DigiKey work well. Similar sensors are available, for cheap, at RadioShack and at several websites online.
Give yourself some time to test and consider how it will be read over the microphone jack. The microphone jack has a small power output, too small to light up most LEDs.
More Complex Sensors
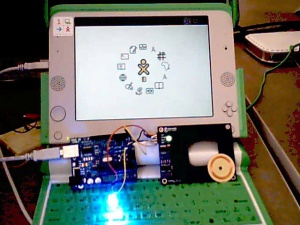
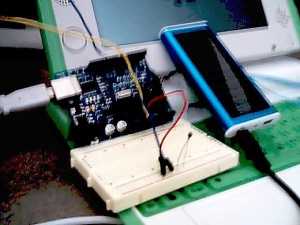
If you want a 5-Volt power source or have a difficult-to-interpret sensor (RFID was a good example of this), it may help to use an Arduino.
Sensor Values Onscreen
Edit drawwaveform.py to add more sensors and write numbers to the pango layout form (where Temperature and Light values are displayed).
