Learning activities/School Census: Difference between revisions
| (28 intermediate revisions by 5 users not shown) | |||
| Line 1: | Line 1: | ||
{{Translations}} |
|||
==Notes from Nigeria 5/07== |
==Notes from Nigeria 5/07== |
||
| Line 9: | Line 10: | ||
[[Image:Graph3.jpg|frame|It took a long time for some, but those who finished faster helped the others.]] |
[[Image:Graph3.jpg|frame|It took a long time for some, but those who finished faster helped the others.]] |
||
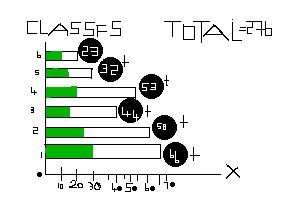
''"Wednesday was for Primary 6... [The teacher] chose to do math. The topic was graphs. He introduced the concept of ‘population’ to the children, asking them if they knew what it meant. We listened to different answers. Then he explained that the objective of the day was to know the population of Galadima School and how they could represent it with graphs. He went on to explain bar graphs. Afterwards, with my suggestion, we split into 5 teams, and each one had to go to a classroom and count the number of boys and the number of girls in it. My team had to go to Primary 5. The children asked the classroom teacher for permission to count the students because it was part of their class work. When we came back, [the teacher] explained with lots of details how to graph the Galadima School population. Children didn't wait until he explained the whole thing. They were already in Paint making the graph. They wanted to be accurate, so they tried and tried... and tried and tried... until one of them came up with a way to do it easier or faster. Then they shared the trick with the others... but then someone else came up with a way of doing it more accurately and passed it on to the others... Everybody was really into their work or helping others..."'' |
''"Wednesday was for Primary 6... [The teacher] chose to do math. The topic was graphs. He introduced the concept of ‘population’ to the children, asking them if they knew what it meant. We listened to different answers. Then he explained that the objective of the day was to know the population of Galadima School and how they could represent it with graphs. He went on to explain bar graphs. Afterwards, with my suggestion, we split into 5 teams, and each one had to go to a classroom and count the number of boys and the number of girls in it. My team had to go to Primary 5. The children asked the classroom teacher for permission to count the students because it was part of their class work. When we came back, [the teacher] explained with lots of details how to graph the Galadima School population. Children didn't wait until he explained the whole thing. They were already in Paint making the graph. They wanted to be accurate, so they tried and tried... and tried and tried... until one of them came up with a way to do it easier or faster. Then they shared the trick with the others... but then someone else came up with a way of doing it more accurately and passed it on to the others... Everybody was really into their work or helping others..."'' --[[User:Carla|Carla Gomez Monroy]], Learning Consultant, OLPC |
||
{{:Adapt_this_story}} |
{{:Adapt_this_story}} |
||
==Activity: School Census== |
==Activity: School Census== |
||
Count the number of students in your |
Count the number of students in your class; then, make a graph to display your results. |
||
=== Created By === |
=== Created By === |
||
School [[OLPC Nigeria/Galadima|Galadima]], Primary 6 Teacher |
|||
=== Suggested Age Group === |
=== Suggested Age Group === |
||
| Line 30: | Line 31: | ||
===Goals and Objectives=== |
===Goals and Objectives=== |
||
Understanding the concept of population. |
|||
''Short description of learning objectives.'' |
|||
Understanding the concept of bar graphs. |
|||
Practicing counting skills. |
|||
Teamwork. |
|||
===Resources=== |
===Resources=== |
||
*Pencil and paper |
*Pencil and paper |
||
*XO with [[Draw]] |
|||
===Activity=== |
===Activity=== |
||
#Introduce concept of population, using example of |
#Introduce concept of population, using example of class as population. |
||
#Explain how to represent population with a bar graph. |
#Explain how to represent population with a bar graph. |
||
#Split into groups of four- |
|||
#Split into teams-- one team for each classroom in school (or grade)-- and send students to count the number of boys and girls in each class. |
|||
#In teams, use Draw to make a graph for each classroom. |
|||
===Extended Activities=== |
===Extended Activities=== |
||
====Family Census==== |
|||
#Combine graphs to make graph for entire school (or grade). |
|||
#Count the members of your family. |
|||
#Collect family data to make graph of family size. |
|||
For your group: |
|||
| ⚫ | |||
Count number of girls |
|||
| ⚫ | |||
count number of boys |
|||
#Elementary Statistics: http://www.oercommons.org/courses/elementary-statistics/ |
|||
each group will collect the following data on each member |
|||
number of people in the house |
|||
age groups (1-5, 6-10etc) |
|||
number of boys, girls |
|||
US born/Non US born |
|||
Make the following graphs: family size, number of children, number of girls, and number of boys. |
|||
Create class data and new graphs for the entire classes data |
|||
| ⚫ | |||
How does the actual size, sex and ages of your family compare to the averages of the class? |
|||
====Pie and Bar Charts==== |
|||
# Use the data to create both Pie and Bar charts for all the data. Each chart should include the class data. |
|||
| ⚫ | |||
*Poll Builder: [[Poll_Builder:_Lesson_Plans_Overview|Lesson Plan Overview]] |
|||
| ⚫ | |||
*Survey Says: http://www.mamamedia.com/areas/grownups/new/learning/lessons/lesson_12.html |
|||
| ⚫ | |||
''Comments, feedback, links to other classes using this activity.'' |
''Comments, feedback, links to other classes using this activity.'' |
||
[[Category:Galadima]] |
|||
[[Category:Learning Activities]] |
|||
[[Category:Learning activity template]] |
|||
Latest revision as of 22:25, 6 February 2011
Notes from Nigeria 5/07
"Wednesday was for Primary 6... [The teacher] chose to do math. The topic was graphs. He introduced the concept of ‘population’ to the children, asking them if they knew what it meant. We listened to different answers. Then he explained that the objective of the day was to know the population of Galadima School and how they could represent it with graphs. He went on to explain bar graphs. Afterwards, with my suggestion, we split into 5 teams, and each one had to go to a classroom and count the number of boys and the number of girls in it. My team had to go to Primary 5. The children asked the classroom teacher for permission to count the students because it was part of their class work. When we came back, [the teacher] explained with lots of details how to graph the Galadima School population. Children didn't wait until he explained the whole thing. They were already in Paint making the graph. They wanted to be accurate, so they tried and tried... and tried and tried... until one of them came up with a way to do it easier or faster. Then they shared the trick with the others... but then someone else came up with a way of doing it more accurately and passed it on to the others... Everybody was really into their work or helping others..." --Carla Gomez Monroy, Learning Consultant, OLPC
Task: Adapt This Story
Help adapt this story into a learning activity for children around the world.
What kinds of activities do we want? Read our educational activity guidelines to understand our vision for learning. Or, take a look at some sample learning activities to get a sense of what we're looking for.
Does this activity look good to you? Try it in your classroom and use the discussion page to tell us how it went. Or, use one of our activity templates to create a related activity and link to it below.
Activity: School Census
Count the number of students in your class; then, make a graph to display your results.
Created By
School Galadima, Primary 6 Teacher
Suggested Age Group
Grades 4-6
Subjects and Skills
Math: Counting, graphing, understanding data and statistics.
Arts: Understanding visual displays of information, creating graphs with Draw
Technology: Using Draw to make graphs.
Goals and Objectives
Understanding the concept of population.
Understanding the concept of bar graphs.
Practicing counting skills.
Teamwork.
Resources
- Pencil and paper
Activity
- Introduce concept of population, using example of class as population.
- Explain how to represent population with a bar graph.
- Split into groups of four-
Extended Activities
Family Census
For your group: Count number of girls count number of boys each group will collect the following data on each member
   number of people in the house
   age groups (1-5, 6-10etc)
   number of boys, girls
   US born/Non US born
Make the following graphs: family size, number of children, number of girls, and number of boys.
Create class data and new graphs for the entire classes data
How does the actual size, sex and ages of your family compare to the averages of the class?
Pie and Bar Charts
- Use the data to create both Pie and Bar charts for all the data. Each chart should include the class data.
Related Activities
- Poll Builder: Lesson Plan Overview
- Bar Charts: http://cnx.org/content/m10217/latest/
- Survey Says: http://www.mamamedia.com/areas/grownups/new/learning/lessons/lesson_12.html
Commentary
Comments, feedback, links to other classes using this activity.


