MapStats: Difference between revisions
| Line 29: | Line 29: | ||
Spanish and French are spoken by millions of Americans. Where do we expect to find the most Spanish speakers? The most French speakers? |
Spanish and French are spoken by millions of Americans. Where do we expect to find the most Spanish speakers? The most French speakers? |
||
Cultural geography is the study of how languages, religions, and pop culture spread over the globe. A map of French and Spanish speakers in the US tells about both history and modern culture. |
Cultural geography is the study of how languages, religions, and pop culture spread over the globe. A map of French and Spanish speakers in the US tells about both history and modern culture. A map gives an impression different from a simple list of statistics. |
||
[[Image:MapStats3.jpg]] |
[[Image:MapStats3.jpg]] |
||
Revision as of 20:22, 15 May 2009
MapStats
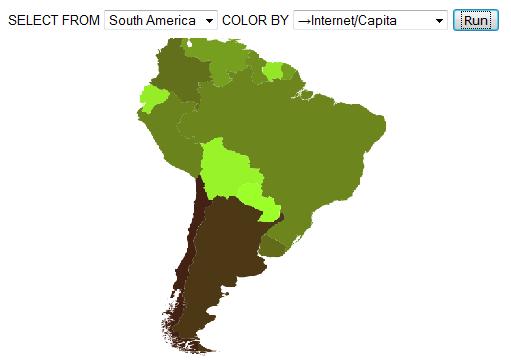
MapStats introduces students to mapping technology/GIS, statistics, and databases. The program can be used to teach students about cultural geography, the digital divide, global health, and history (see the Learning section).
The MapStats activity allows students to view and edit maps without internet access. It also supports online services to share more data, regional maps, and lesson plans.
Mapping Technology
One of the leading technologies in the developing world is development and content-creation in mapping. These programs are often called Geographic Information Systems (GIS).
Included Maps
United States, North America, South America, Europe, Africa, Asia, Middle East
Included Data
Population, area, GDP, year of independence/statehood, major languages, population density, spread of internet and mobile phones, HIV/AIDS, malaria, scientific papers, coastline, and population in 1950
Learning with MapStats
Level 1: Using Maps for Information
Closing the Digital Divide
The OLPC project is one of many programs working to close the Digital Divide, the gap between people with and without computer access. Computers and the internet allow people unparalleled access to education, information, and media. It also empowers people to share their work and participate in high-tech jobs.
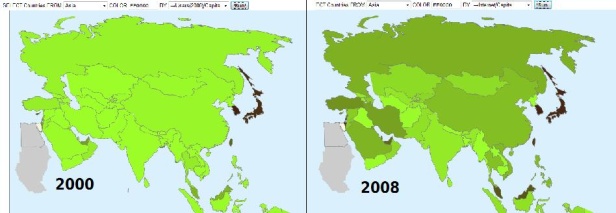
A map can show how access to technology is changing the globe. Maps of internet users/capita on the Asian content show how many more countries have plugged into the global network over just the last 8 years. One wonders what kind of online communities and resources will exist once all countries gain widespread internet access.
Cultural Geography: English, Spanish, and French in the US
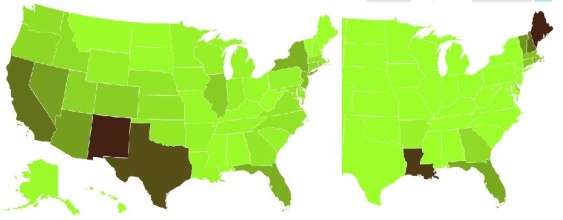
Spanish and French are spoken by millions of Americans. Where do we expect to find the most Spanish speakers? The most French speakers?
Cultural geography is the study of how languages, religions, and pop culture spread over the globe. A map of French and Spanish speakers in the US tells about both history and modern culture. A map gives an impression different from a simple list of statistics.
Global Health: Malaria Crisis
Level 2: MapStats as a Database
Highlighting Coastal Areas
US History: Statehood
Level 3: Creating and Sharing Maps
Viewing Online Data
Viewing Online Maps
Creating and Sharing Data
Programming
The program mainly relies on JavaScript within SVG maps from Wikipedia. You can add your own regional map if it is in SVG format.
The offline data is stored in JavaScript arrays.


