Model/Mockups
< Model
Jump to navigation
Jump to search
Proposed Model workflow
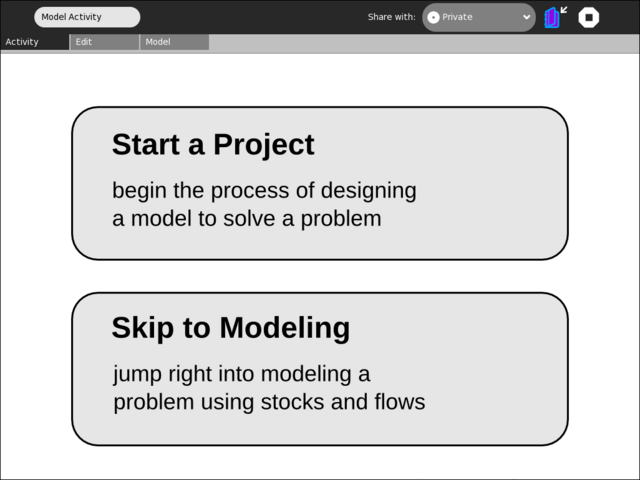
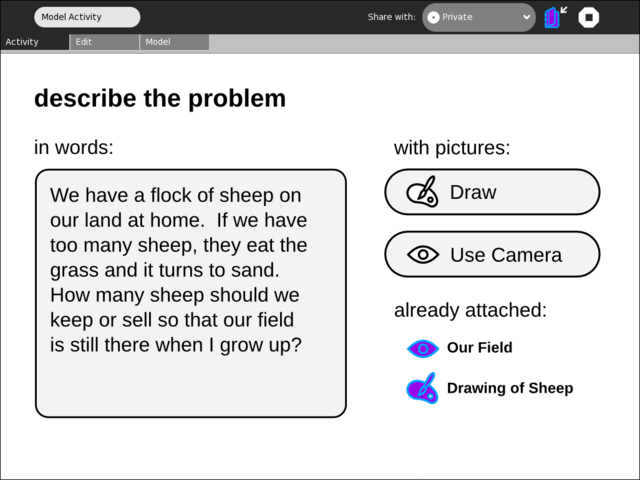
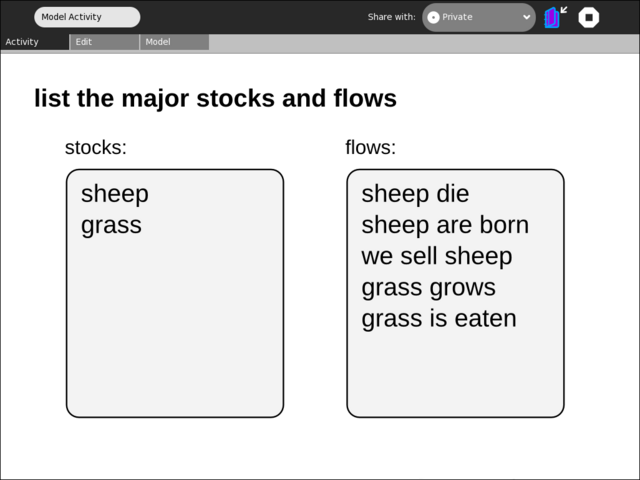
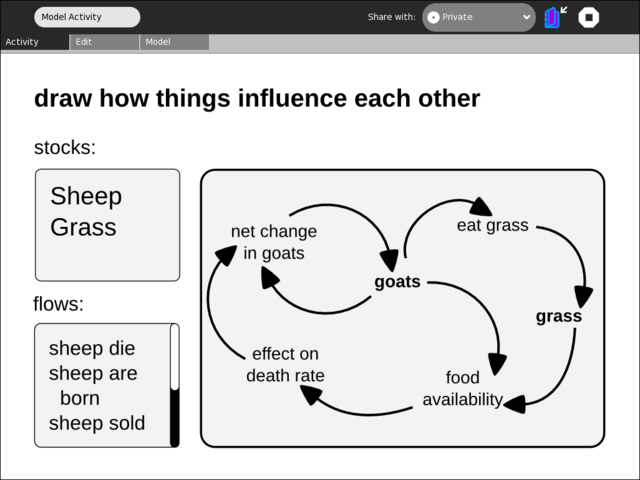
These are mockups of how I would like Model to function. The idea is to capture as much of the modelling process, and its iterations, in the activity. This is an easy way to generate documentation for models, and encourages best practices. What is not shown is a method for navigating through the process, but this could probably be accomplished on a toolbar at the top of the screen
01
back | next
02
03
04
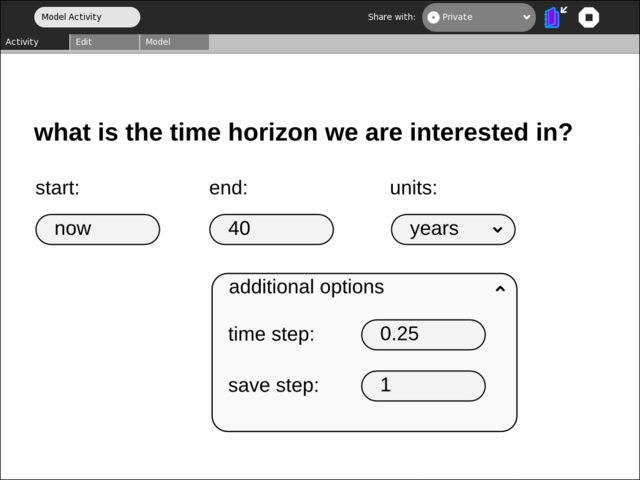
There should be an easy way for kids to specify, and understand, the time horizon of the simulation. Using several natural language constructs, such as 'now' instead of '0', could help with this. It would also be nice to allow access to things like the save-step and time-step, but these are probably not helpful for the beginner so they will be hidden by default.
05
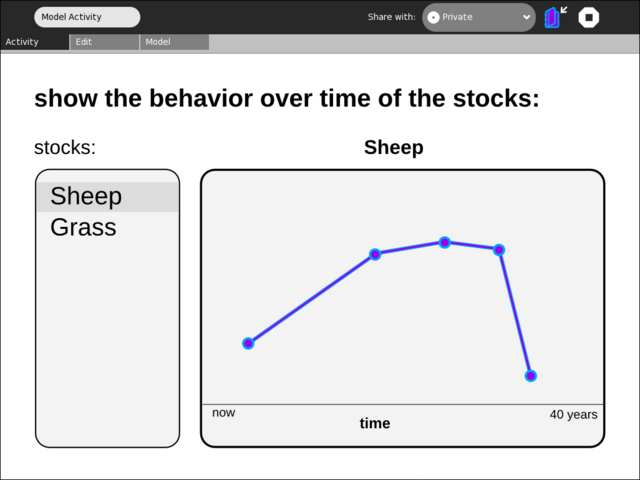
Behaviour over time graphs are very powerful tools for developing systems thinking. I want to allow kids to select a stock and put key points on the graph, with lines being added automatically. After we have a running simulation, these behaviour graphs can be overlaid with the actual structure of the model to see how they match up, naturally bringing kids back to evaluate their original thinking.
06
07
back | next
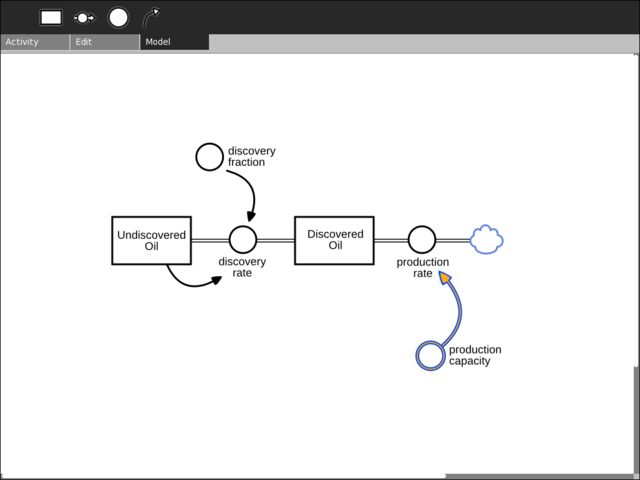
Finally, this is how the modelling canvas will look for stock and flow drawings. It uses common symbols so that proficiencies can be transferred across programs. The most notable thing is that when you are modelling collaboratively, structure added by other people will show up in the color of their XO, at least for a short period of time.
