Measure/Blog
(be sure to include as many pictures as you can)
Comments After Using the Measure Activity
This is based on using Build 656. I mainly used the built=in microphone.
Bias Control
In "The Software", when describing the ‘’’bias control button’’’ it is stated: The built in mic requires this to be OFF”. I assume the icon for “Bias On” is the one that shows an arrow on the left slightly lower than the line on the right (and hovering over the button gives “Click for Bias Off”). However, I find that this setting (Bias On) is the one that causes the mic to give a noticeable display.
Show Values
- The values of the scale are given as the size of the input per grid division. This seems the most useful way to define scale, but it is not consistent with the larger scale value giving a larger displacement on the display. For the x-axis, moving the upper slider to the right leads to a smaller scale value (0.104 ms/div.) compared to moving the slider to the far left (1.25 ms/div.) the slider to the right also produces a more spread out wave (for a constant frequency sound). However, for the y-axis, moving the slider on the right to the top produces a larger listed scale value (about 90 mV/div) but also larger amplitude on the display than when the slider is at the bottom. Furthermore, as one moves the slider slowly down from the top, the listed scale values decrease (in mV/div) from 90 to 80, then suddenly increase to 190 (at which point the amplitude of the display drops markedly). It then continues to steady decrease (except for one other small jump upwards at slightly below half-way to zero). The non-linearity of the scale control does not seem as serious as the inconsistency between the listed scale values and the response of the display. I tested this using an audio test program on an iMac as a constant amplitude and frequency sound source.
- In listing the scale values and AVG/RMS, values are given to 10-16 significant figures. I don’t suggest teaching appropriate use of significant figures here, but it should model appropriate use. The present listing would be confusing to children (and most adults) and certainly not correct, both given the accuracy of the circuits and the pixels in the display.
- The listed values of AVG and RMS both remain almost constant (at about 1200mV and 370mV respectively) when the input is a tone (at a constant frequency which varies in amplitude (as shown on the display) from 1 V down to 0V.
Display Grid
I find the gray grid lines very difficult to see, especially when trying to estimate the value the quite bright green line is at. It would be very helpful to have bright short line segments where the grids intersect the axe.
Log
I think that it would it be more useful to specify the total time over which to log data, rather than the interval between recordings. The software could select an appropriate time interval between recordings in order to produce s continuous graph. This seems more related to what the child is interested in, seeing what happens over some time interval. Bob 01:30, 23 April 2008 (EDT)
Some of my ideas, thoughts, back-of-an-envelope sketches and musings regarding hardware interfaces to Measure:

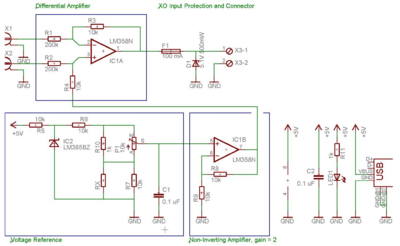
A redrawn schematic of the differential amplifier as shown on Measure/Projects - I've added a fuse and 5.1V Zener diode on the XO input, as you can see - this should, hopefully, be suitable for making these types of electronic interfaces for the XO robust and "noobie-proof".
This is all my half-baked, untested, back-of-an-envelope stuff - no promises it works! Peer review, comments, feedback, or criticisms are all welcome.
I don't claim all these ideas as unique or new - but I'm trying to take existing project ideas from the projects page and flesh them out a little more.
I don't have access to an XO-1 machine - if any developers who do might like to test my ideas, as they mature, I'd love to hear the results!
I'm not sure if or how I can upload files in any old - non-image - file format. If so, I will upload - and thereby release under a Free licence - my EDA files for these designs in EAGLE's format.
I'd really like to have access to the schematics for the XO-1 for the microphone input socket - not the whole computer, but just the exact schematics and specifications for exactly what protection circuits or buffers or whatever there are between the input socket and the LM1888 audio chip.
Project ideas
Measuring daily changes in solar irradiance:
Using a suitable interface, such as the above, or even a simple voltage divider, to measure the DC voltage from a photovoltaic module, and log how it changes over a period of a day - I'm sure we could even use the OLPC photovoltaic charging module for this - it has a 12V DC output - just make sure your amplifier/buffer interface will be suitable for the 12V input, and will scale it down to 0-3V, and plug it in!
Optical barrier alarm:
Turn on the voltage bias, and connect a LDR. Say our LDR has 500k dark resistance and max 2800 ohms in light. (That was measured from a mystery one in my junk box.) Given 785 mV bias with 790 ohms effective impedence, we have then, 784 mV dark input voltage, and 612 mV light input voltage - quite detectable discrete levels.
1 mW 660nm red laser diode modules are cheap and easily accessible for experimenters - but remember, if working with children or young people, teaching prudent laser safety is a good idea, even at this power level.
Temperature acquisition:
Using the simple LM335 probe, described in detail at Measure, a simple classroom demonstration of Newton's Law of Cooling can be realised, using the computer as a datalogger.
Biomedical instrumentation / Demonstration-grade Electrocardiography:
This isn't intended to be a fully fledged, powerful, diagnostically suitable or useful ECG platform in the same way that TeleHealth is aimed at realising - but it should work, and it might even work well enough with the XO's integrated ADC to work as a proof of concept, or a demonstration.
It's a simpler, smaller, cheaper, non-diagnostic ECG, that might be valuable as a teaching or demonstration tool. It will certainly work, and show an ECG signal. At least, it should.
This only has two electrodes - and needs to be combined with an ADC - probably the XO's inbuilt ADC - the voltage levels will always be within 0-5 V.
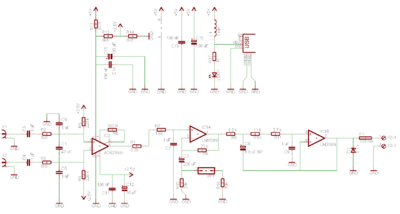
As in the above schematic, a 5.1V Zener diode can be included on the input line to the XO to clamp it - along with a fuse to limit current into the XO at 100 mA; "just in case".
Also, as in the schematic shown above, power is also derived from the USB port's 5V rail.
Water tank level measurement
The easiest way to realize this would be using a small differential pressure sensor, connected to a plastic hose which is inside the bottom of the tank, and comes out the top to the sensor. The analog output from the sensor can then be interfaced, fairly simply, to the XO.
The Freescale Semiconductor MPX12GP looks ideal for this.
Milk Quality Sensor
As many of you will know, there's been a lot of talk about this interesting project in relation to the FabLab project in rural India. It would certainly be a cool application to port over to OLPC, for the developing world, with the XO hardware and software based on or derived from the Measure activity. Unfortunately, I've got no idea how the milk analysis works, or how it is implemented in hardware.
It could be done with an electronic pH probe, probably.
Pulse Sensor - Infrared Pulse Plesysmograph
An IR plesysmograph (That thing that you might have seen used in a hospital for example, where it is clipped on the finger and measures heart rate, by transmitting IR light through the tissue) can be constructed quite cheaply, using a 5mm IR LED, and an IR phototransistor, mounted on a standard wooden clothes peg, in conjunction with a simple interface circuit, similar to those shown above, based on an LM358 operational amplifier IC.

