Ejabberd resource tests
The purpose of these tests
The XS school server is going to be installed in schools with more than 3000 students. In these large schools, ejabberd is crucial for functional collaboration. If all the students are using their laptops at once, ejabberd might be considerably stressed. These tests were run to find out how it runs in various circumstances.
Set up
The cpu of the server running ejabberd reports itself as "Intel(R) Pentium(R) Dual CPU E2180 @ 2.00GHz". The server has 1 GB ram and 2 GB swap.
The client load was provided by [http://dev.laptop.org/git?p=users/guillaume/hyperactivity/.git hyperactivity]. Each client was limited in number of connections it could maintain (by, it seems, Telepathy gabble or dbus), so several machines were used in parallel. Four of the client machines were fairly recent commodity desktops/laptops -- one was the server itself -- and four were XO laptops. The big machines were connected via wired ethernet and could provide up to 250 connections each, while the XOs were using mesh and providing 50 clients each. From time to time hyperactivity would fail with these numbers and have to be restarted.
It took time to work out these limits, so the tests were initially tentative. The graphs below, the script that made them, longer versions of these notes, and perhaps unrelated stuff can be found at [1].
In order to test, I had to add the line
{registration_timeout, infinity}.
to /etc/ejabberd/ejabberd.cfg (including the full-stop).
First try: 523 accounts, single client machine
Mostly by accident, 523 ejabberd accounts were created. These accounts were used in 25 connection increments, connecting from just one client.
The memory numbers were gathered after the load had settled after a few minutes. Peak use was perhaps 10% higher.
 Clients  interval  mem     load avg     client OK     server OK
 ---------------------------------------------------------------
   1      15         69      0.01         True          True
  50      15         72      0.02         True          True
 100      15         68      0.12         True          True
 125      15         74      0.08         True          True
 150      15         82      0.22         True          True
 175      15         84      0.24         True          True
 200      15         92      0.21         True          True
 225      15         96      0.06         True          True
 250      15        101      0.13         True          True
 275      15        103      0.09         False         True
 300      15        107       -           False         True
 350      15         89       -           False         True
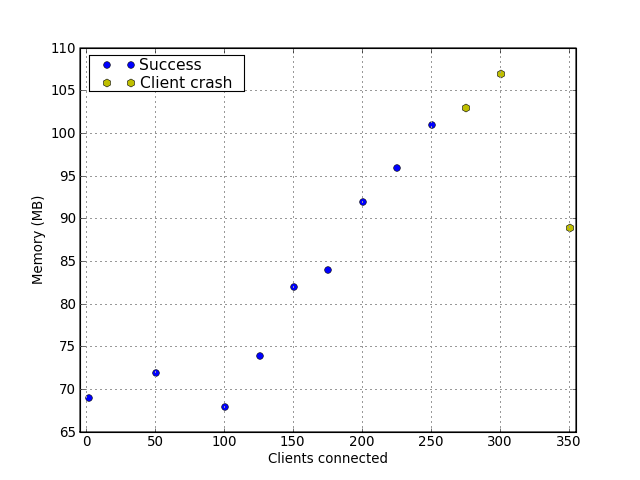
Note: from 275 up the client crashed before the numbers rose and settled down.
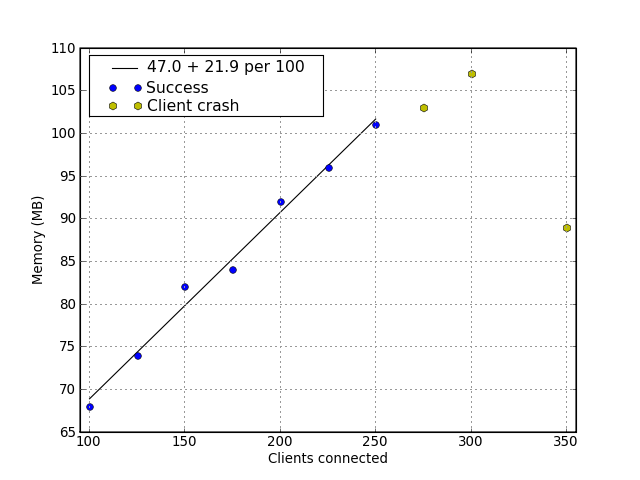
These numbers are probably best viewed as a steady linear increase,
with the low numbers hidden by a noise floor. Seen like that, there
seems to be a memory footprint of 47MB + 22MB per 100 clients.
Extrapolating to 3000 clients would add to about 700 MB, though that
is a very long way to extrapolate.
Second try: 3200 accounts, multiple clients
I ran hyperactivity on several machines to get the following results.
# Tested with 3200 users and 15 second intervals from 3 clients (2 XOs
# 50 each; toshiba laptop - up to 275).
#
# Clients  secs     mem       load avg     client OK     server OK

  100      15       119        0.12         True          True
  150      15       129        0.16         True          True
  175      15       145        0.38         True          True
  200      15       151        0.25         True          True
  225      15       166        0.31         True          True
  250      15       172        0.40         True          True
  275      15       179        0.43         True          True
  300      15       189        0.43         True          True
  325      15       194        0.51         True          True
  350      15       200        0.67         True          True
  375      15       206        0.60         False         True

#Starting 200 users from xs-devel (martin's dell core2 duo laptop)
# then adding 2  XOs with 50 each
# then steps of 25 from the toshiba

  200      15       167        0.20         True          True
  300      15       182        0.20         True          True
  375      15       211        0.80         True          True
  400      15       222        0.77         True          True

#adding another XO
# web interface is very slow to report these connections,
# getting stuck first on 427

  427      15      253         0.86         True          True

# stop all but 1 XO (now dell 200, toshiba 100, XO 50).
  350      15      234         0.56         True          True

#restart 3 XOs, 1 at a time

 400       15      232         0.88         True          True
 450       15      240         0.96         True          True
 500       15      104         1.02         True          False

# web interface dies at 500-15.  mem drops to 89.
# sharing works for new connections
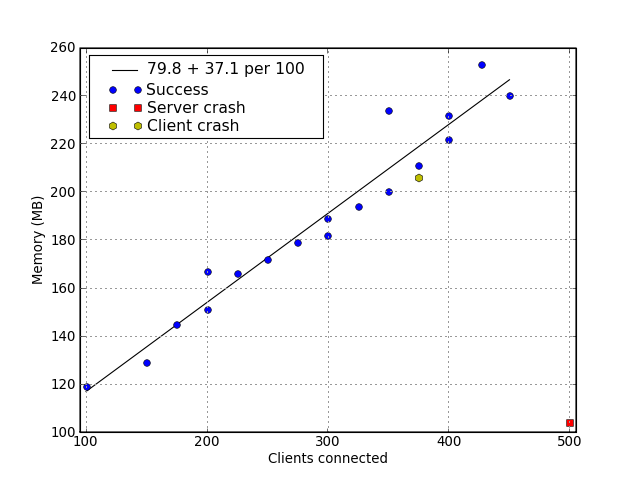
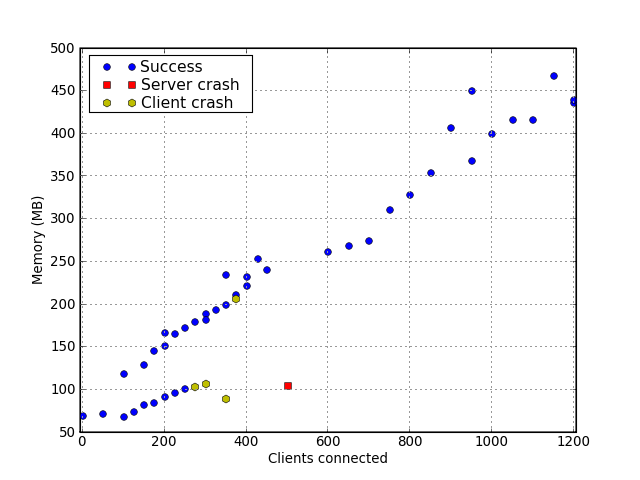
However I tried it, ejabberd would always crash with around 500 connections.
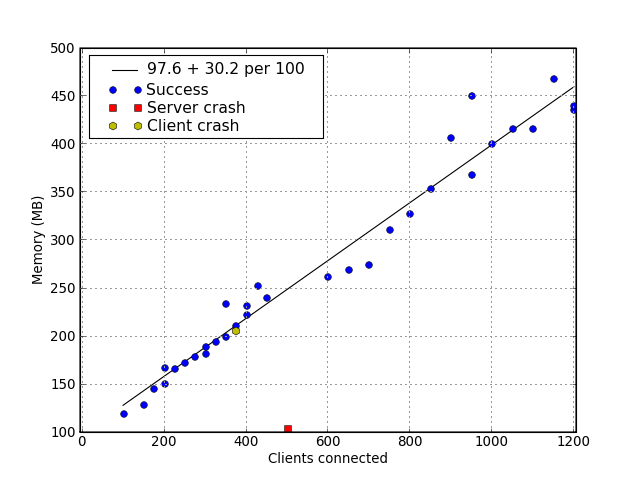
This shows that memory usage is fairly well predicted as 80 MB + 37MB per 100 active clients. That would mean an ejabberd instance with 3000 active clients needs about 1200MB.
The load average jumps around a bit, but definitely goes up as clients are added.
Try 3: 3000ish clients; past the 500 connection barrier
Eventually I thought to increase the number of open files that ejabberd can use, which allowed it to maintain more than 500 connections. This can be done in a couple of ways: most properly by adding these lines to /etc/security/limits.conf:
 ejabberd         soft    nofile          65535
 ejabberd         hard    nofile          65535
or by putting this line in /etc/init.d/ejabberd:
 start() {
+       ulimit -n 65535
        echo -n $"Starting ejabberd: "
which shouldn't require a new login to take effect.
I started with about 2900 clients, but hyperactivity increased this as it created new clients. It got to around 3300. The number of inactive clients seems to have relatively little effect on ejabberd, so I'm ignoring this.
# Starting with 2926 registered users
# open files set by ulimit to 65535
#
# Clients  secs     mem       load avg     client OK     server OK

  600      15       262        0.75         True          True
  650      15       269        0.84         True          True
  700      15       274        1.12         True          True
  750      15       311        1.32         True          True
  800      15       328        1.66         True          True
  850      15       354        1.80         True          True
  900      15       407        1.83         True          True
  950      15       368        1.78         True          True
  950      15       450        1.78         True          True
 1000      15       400        1.80         True          True
 1050      15       416        2.06         True          True
 1100      15       416        2.01         True          True
 1150      15       468        2.04         True          True
 1200      15       436        2.07         True          True

# drop all but 200 clients, wait 5 minutes.
# 200      15       371        0.63         True          True
 1200      15       440        1.89         True          True

# memory use was really jumpy. These numbers are approximately what
# the system converged on over time.
# (e.g. 1000 clients peaked over 500M, dropped to 390ish)
#
# After 800, clients sometimes dropped off.
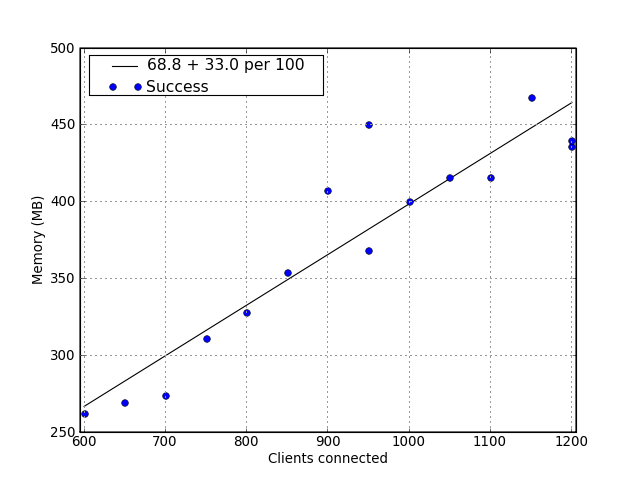
1200 is about the limit that my test setup can get to (i.e. 4 * 250 + 4 * 50). ejabberd ran quite happily at that point, though the load averages suggest it would not have liked much more.
ejabberd peaked at 667.6MB, and went over 500 several times. These fleeting binges tended to follow the connection of new clients. As hyperactivity connects with unnatural speed, it would unfair to judge ejabberd on those numbers, but it does seem that ejabberd could do with 50% headroom over its long term average.
This set gives us 69MB + 33 per 100, or about 1070MB for 3000, and it suggests that 1.6 GB would accommodate surges. A faster processor is almost certainly necessary.
Here is a graph combining the last 2:
and here is one with them all, without the line (remember the lower set had a quite different number of accounts):
Memory use of inactive users
# Adding users, restarting to find the base load of registered inactive users.
#
# users  after add      after restart
  523      -             27.2
  670     59.5           31.1
  924     83.4           39.4
 1024                    45.4
 1324     84.7           50.0
 1574    113.9           54.1
 1774    116.0           64.1
 1974    120.1           65.2
 2200    130             71.0
 2400    131             75.7
 2600    130             85.3
 2800    138             83.2
3200 160 93.7
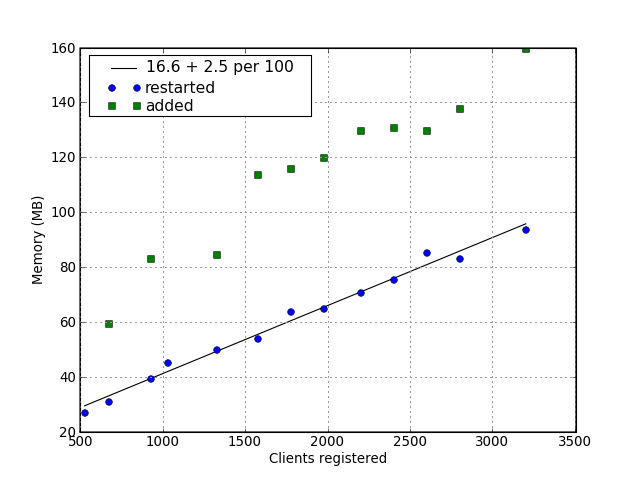
This suggests the memory cost of registered inactive users is also linear, and relatively low at 16.6MB + 25MB per thousand.
Issues
- Is pounding ejabberd every 15 seconds reasonable? A lighter load
 actually makes very little memory difference, but it probably saves
 CPU time.
