Measure
see more templates or propose new |
What is the Measure Activity ? (Introduction)
The Measure Activity is a tool on the XO that allows kids to indulge in "learning by doing". It provides an interface for the kids to connect with the physical world and an opportunity to view and understand through a visual and statistical representation of the physical phenomena.
Using the Measure Activity on the XO, one can -
- Connect sensors (light, heat, magnetic field etc) and view their signal. Thus it is possible to view and study physical phenomena
- Input voltages and signals into the XO laptop and use it as an oscilloscope and
- Log data at a specified interval and store and retrieve waveforms
Learning Activities
Introduction
Children learn by doing things. It is said "Give a child a hammer, and the world becomes his nails". This activity is a tool that allows kids to express their curiosity. It is a tool that allows kids to explore and learn by doing, by connecting and observing, span physical phenomena and real world events.
Activity activities (hands on learning activities)
See the projects page for detailed instructions on a few projects. Also see the hardware page for other ideas.
Some threads for interesting learning experiments are below -
- Record animal sounds , for example, sounds of birds and observe their waveforms. Which of these are high frequency sounds, which are the low frequency ones ? Adjust the frequency sliders accordingly.
- Whistle into the mic and compare the loudness and frequency of whistles by observing the waveforms.
- Get two people to try to whistle the same note, and look into Beat Frequencies.
- Turn the sensitivity slider up to the maximum and observe ambient noise - in a quiet room, near a noisy road
- Measure the voltage of an AA size pencil cell. What settings do you use ? AC or DC ?
- Measure resistance of water , other liquids
- Log temperature using a temperature sensor at one hour intervals. When in the day is it the hottest ? The coldest ?
- Some very interesting sensor ideas given by Arnans Roger , see - http://padthai.media.mit.edu:8080/cocoon/gogosite/documentation/makingSensors.xsp?lang=en
Let's measure Temperature! ( Featured activity of the month )
Construction
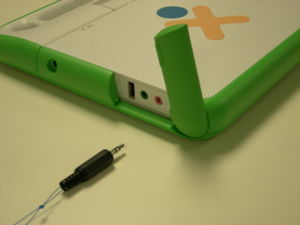
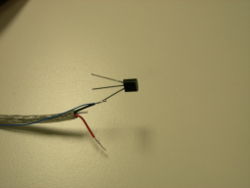
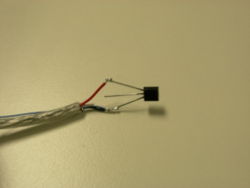
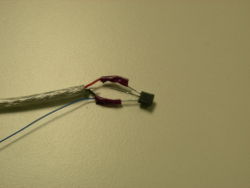
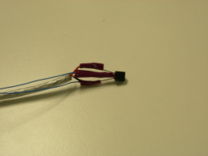
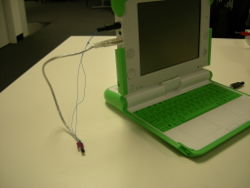
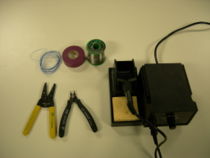
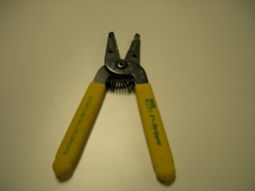
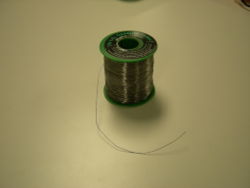
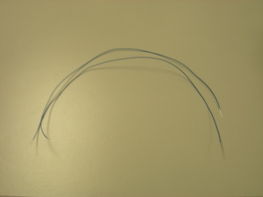
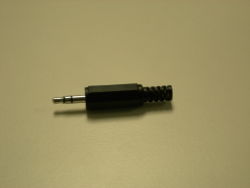
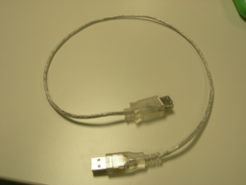
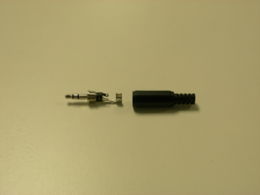
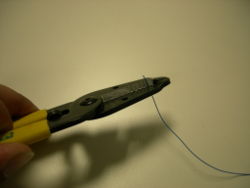
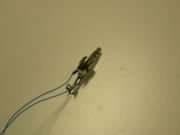
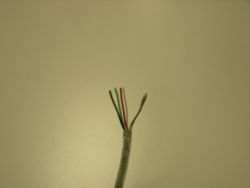
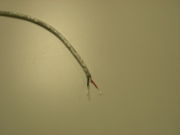
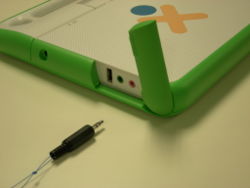
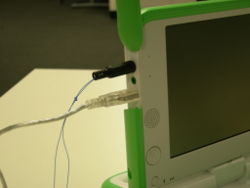
You should build the probe as outlined in how to connect sensors before moving forward
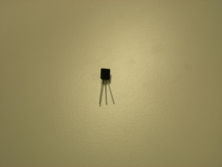 You would need a temperature sensor like this one LM35. A link is here- http://search.digikey.com/scripts/DkSearch/dksus.dll?Detail?name=LM35DZ-ND |
||
Operation and measurement
Learning activities
Downloading the Activity
Please visit the download page to download the latest stable and unstable releases of the Activity.
Getting started
The software
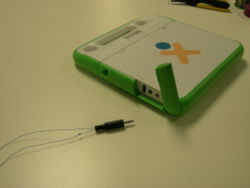
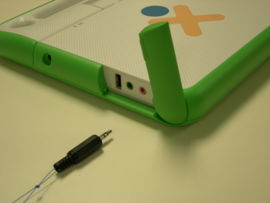
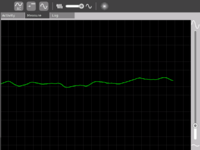
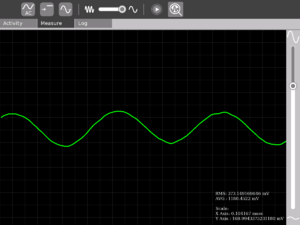
Input:One can connect sensors/give input voltage through the pink Mic jack on the left side of the display screen. When nothing is connected there, the default signal is the sound signal from the built in Mic on the XO. Graph: The green moving line on the screen indicates the signal
Grid and background: The light grey lines that form a criss cross grid allow one to estimate the values of the signal at different instants of time. To get a value, multiply the scale value that appears when one clicks on the "Show values" button in the Measure Toolbar with the number of divisions the grid represents.
Slider on the right: The slider on the right controls the magnification (gain) of the waveform. Move it up if the waveform that you see is too small and move it down is the waveform is going out of the screen.
Measure Toolbar: Use this to view and modify the signal.
AC/DC button -- This button selects whether you want to give a DC input or an AC input. Batteries, light sensors and temperature sensors have DC input. The microphone has an AC input.
Bias control button -- Some sensors would require this ON to work properly, most of the times you wouldn't need to touch this button. The built in mic requires this to be OFF.
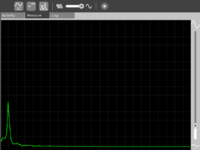
Time/frequency button -- View the signal representation or a real time representation of the signal. Selecting this option is most fun when one is whistling into the microphone. This wouldn't be of much use when connecting external sensors.
Slider -- Move it to the position that allows you to best view the waveform. This slider controls the frequency range.
Show details -- Press this button when you want to see statistical data about the signal. The scales are shown in this option - the X axis scale and the Y axis scale.
Log Toolbar: Use this when you want to record data
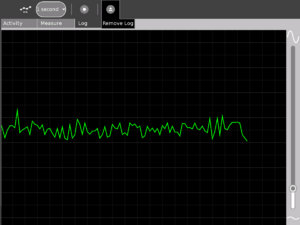
Snapshot/1 second/1 minute/1 hour -- Select the way you want to record data. Snapshot means taking a picture of the current waveform that you see on the screen. 1 second/1 minute/1 hour selects at what interval one can record data.
Show saved data -- Shows you the saved waveform. Press it again to remove the display of the saved waveform.
How to connect sensors (How to build a probe to connect sensors to the XO)
To summarize, do remember that we have identified three terminals
- The "Vin" terminal
- The "+ve" terminal
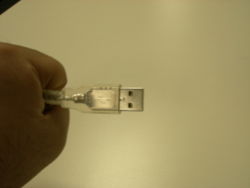
- The "Gnd" terminal (the Gnd of audio connector is connected to Gnd of USB connector"
Getting involved
Educators
Software developers
Help is needed from volunteers from Python developers. Please visit this page to find out details. If you have experience in writing optimized Python code, please leave a note on the discussion tab of this page and someone will get in touch with you.
Hardware enthusiasts
Do interesting hardware projects around the XO. Visit the Measure hardware page to learn more. You might also want to see the projects page.
A note about safety
SAFETY FIRST!
- Make measurements of AC line voltages with the proper equipment only -- for example, a multimeter designed for the purpose. The laptop is not a multimeter.
- If you don't know what you are doing or are unsure, don't do it. Electricity can be dangerous.
Future plans
- Comparison of many graphs
- Sharing of the graphs
- Analog Input support into TamTam jam
Acknowledgments
- Walter Bender - (my adviser) providing invaluable guidance, encouragement and support at all stages of development. I have had immense learning during the development of the Activity and I hope to allow kids to experience learning while using the Activity as much as I experienced while making the Activity.
- Thanks to Mitch Bradley and John Watlington for their help and suggestions during the development of the Activity.
- Thanks for Bernardo Innocenti and Michael Stone for their valuable inputs towards code design.
Contact
Contact Arjun Sarwal through -
Email : arjun@laptop.org
IRC : arjs on #olpc #sugar
Give a child a hammer and the world becomes his nails...


