Ejabberd resource tests/try 4
Try 4: a few thousand users
This test used several copies of hyperactivity on each client machine, all using the same 15 second interval. Its presentation is formatted on a time series: unlike in previous tests, the server only once stabilised on a set number of clients.
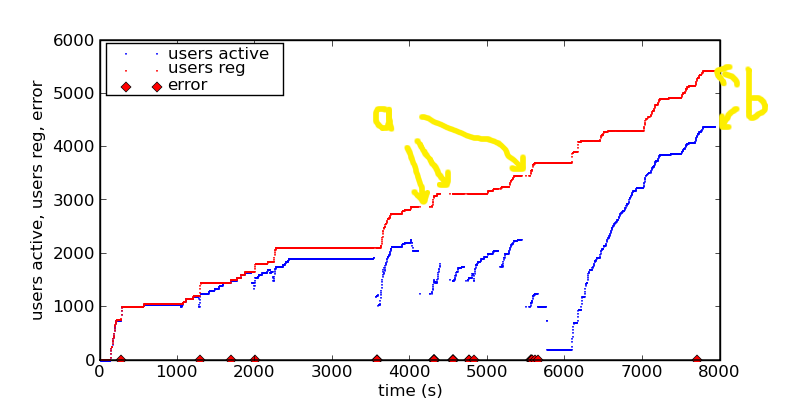
The graph below shows the numbers of registered users and online users over 2 and a bit hours, or about 8000 seconds. The test ended with a ejabberd crash.
The numbers diverge when a hyperactivity instance finishes badly: the accounts are lost to hyperactivity so it creates new ones. After a period of stability with 2000 users, ejabberd went somewhat haywire when more connections were attempted. The points marked a are times when the ejabberd web interface stopped responding (which was the source of the numbers), while b is where it crashed outright.
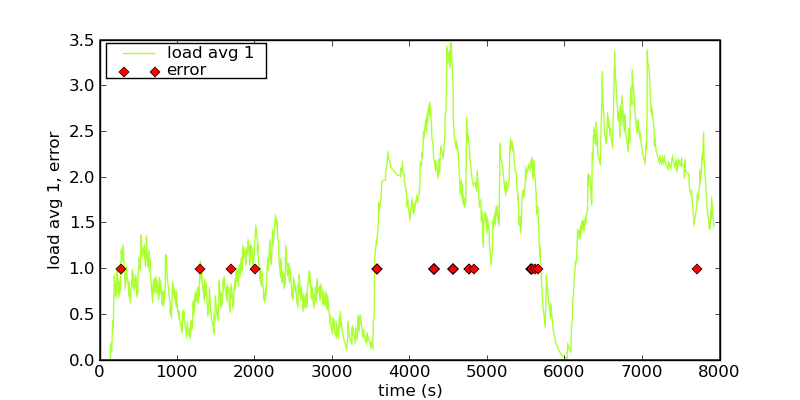
The red lumps along the bottom are points at which ejabberd logged errors.
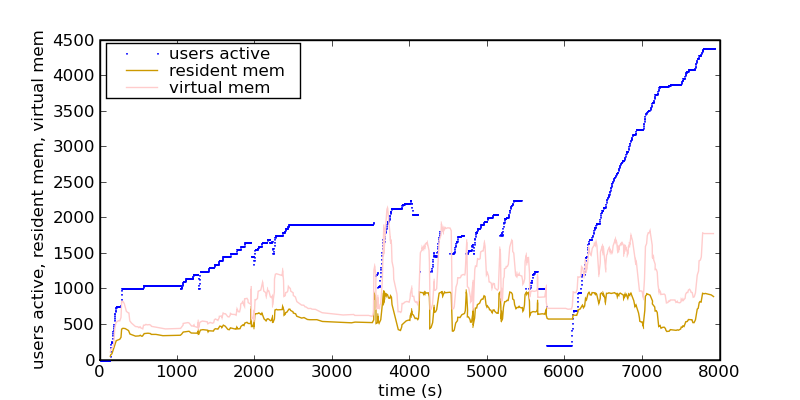
This next graph related memory use against active connections. The server only has 1GB of RAM, so resident memory is restricted below that.
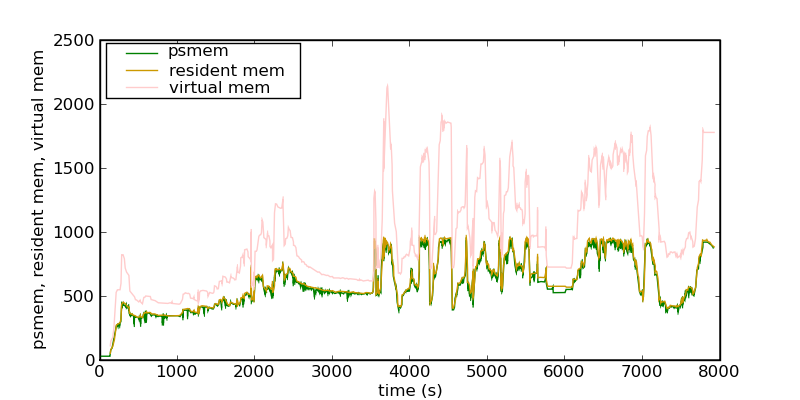
Here's a closer view of the memory, including the ps_mem.py numbers, which closely track top's resident memory report.
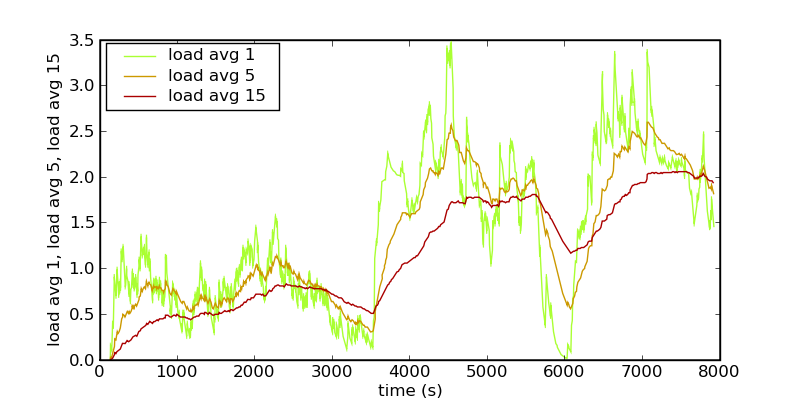
Load average over the same period:
and 1 minute load average vs ejabberd reported errors:
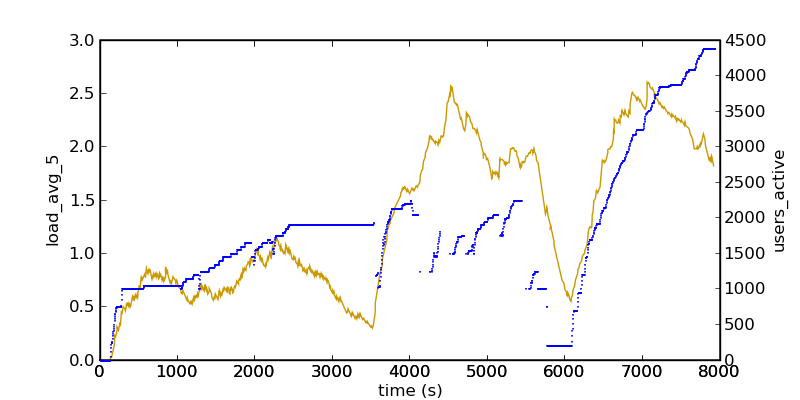
Also load average vs active users:
Load drops quite a lot during the stable period.
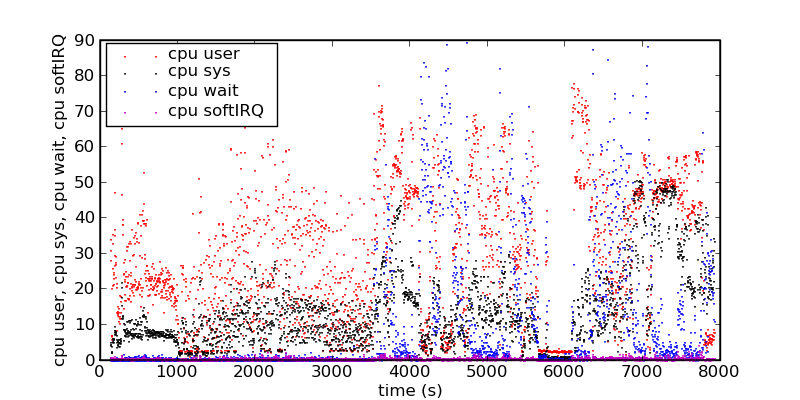
This last picture shows various kinds of cpu usage.
