4c2 power regression
XO-4 model C2 has a power regression from the previous C1 and B1 models
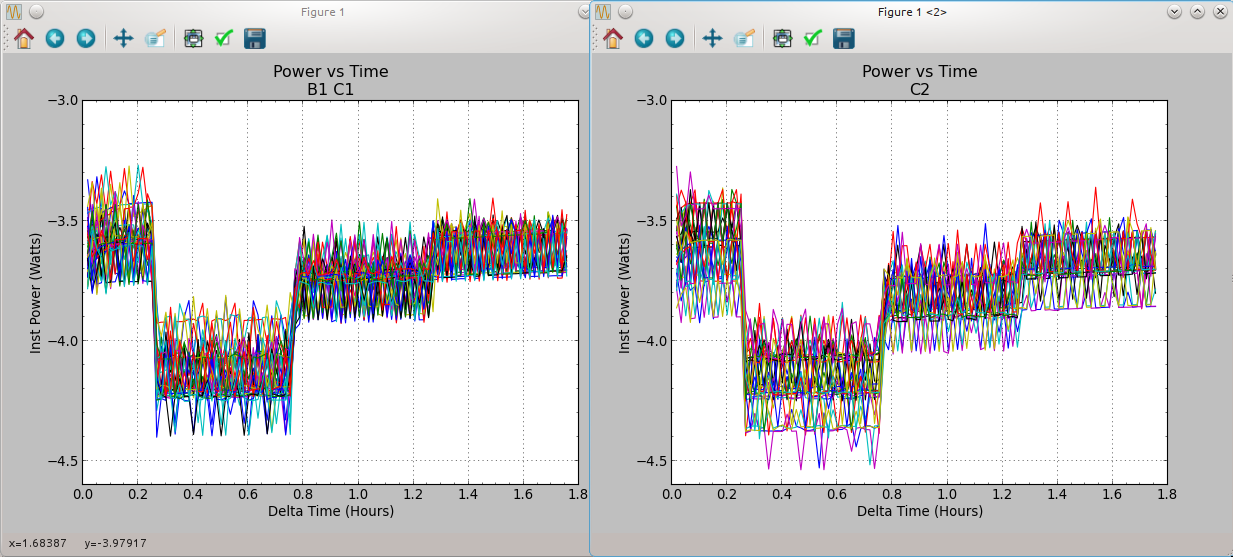
Power testing done by Richard has produced the following graph of the power used by C2 machines vs previous models. This graph is the raw unfiltered samples of several runs of 5 B1 machines 5 C1 machines and 9 C2 machines. The C2 models show to have both an average and peak power draw that is greater than B1 and C1 in all ranges of power testing.
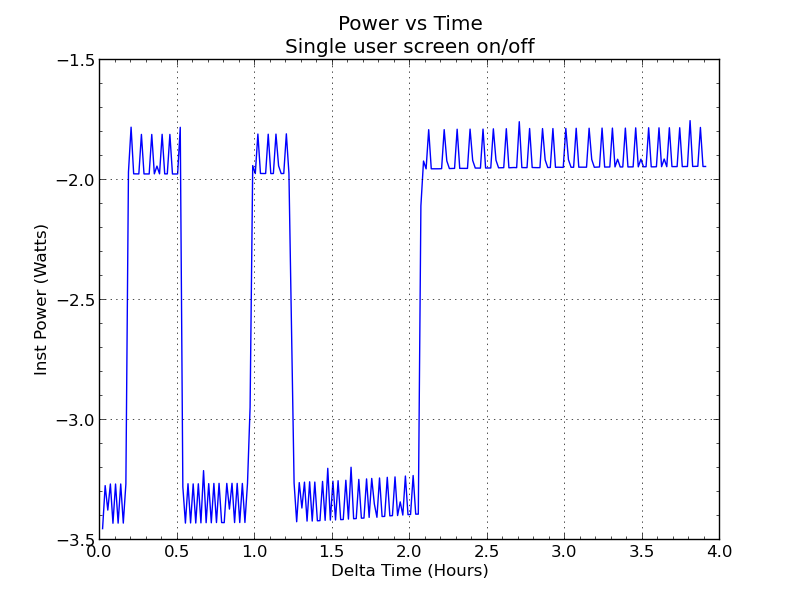
There is some noise in the power measurement. To characterize the noise A baseline noise test of a XO-4 running in single user mode at 2 different power levels was run. (The high power is screen on and low power screen off. It shows that there is approximately 200mW of noise in the measurement but the noise should cancel when looking at the average of several runs.
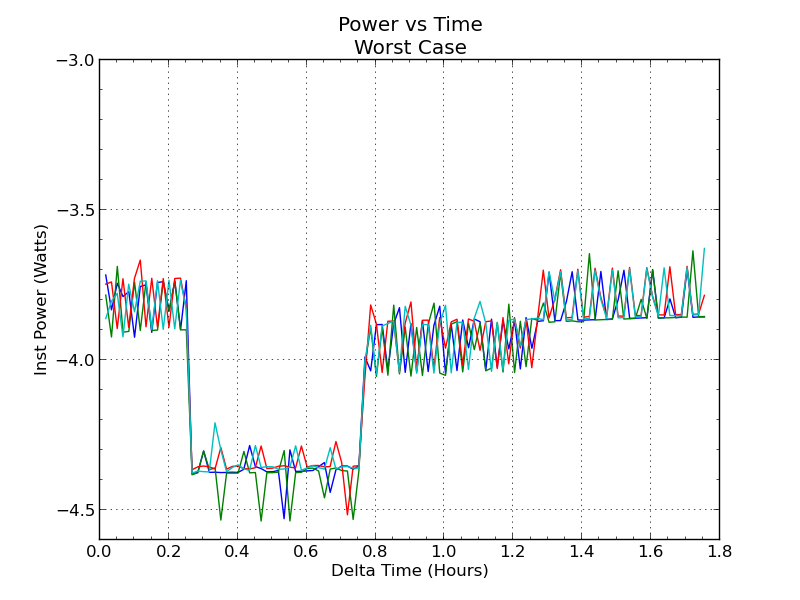
The worst of the 9 C2s tested is SHC3110003E and appears to have consistently high draw.


