Measure
Contents
Introduction
Children learn by doing things. It is said "Give the child a hammer, and the world are his nails".
This activity is a tool that allows kids an expression of their curiosity. It is a tool that allows kids to explore and learn by doing, by connecting and observing span physical phenomena and real world events. Kids would learn by recording and observing the physical phenomena and by connecting their observations to a previously learned concept, or even better - learn the concept based on the experiments and observation.The basic functionality of this activity spans being able to measure DC and AC voltages by observing them on a oscilloscope like interface, logging data at a specified time interval and drawing the graph of logged data.
WARNING : Do not measure the mains voltage, it would destroy your XO
Elements of the Measure activity
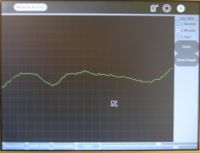
- There is a 1050 X 800 pixels window in which one sees the waveform. There is a light Grey colored grid in the background.
- A slider for selecting different frequency ranges (top slider)
- A slider for selecting the sensitivity of the display - along the Y axis (bottom slider)
- A button to select AC measurement or DC measurement
- A button to switch Off/On the internal bias - Some microphones don't require an internal bias, most sensors do require a bias.
- A button to Stop/Start the waveform display
- Radio buttons to selectable data logging interval
- A button to Start / Stop the data logging and record it onto a file
- Draw graph of logged data from a previously recorded log file
A short video
<videoflash>http://youtube.com/watch?v=FE1ufEIXLVo</videoflash>
Learning activities
1. Record animal sounds , for example, sounds of birds and observe their waveforms. Which of these are high frequency sounds, which are the low frequency ones ? Adjust the frequency sliders accordingly.
2. Whistle into the mic and compare the loudness and frequency of whistles by observing the waveforms.
3. Turn the sensitivity slider up to the maximum and observe ambient noise - in a quiet room , near a noisy road
4. Measure the voltage of an AA size pencil cell. What settings do you use ? AC or DC ?
5. Measure resistance of water , other liquids
6. Log temperature using a temperature sensor at one hour intervals. When in the day is it the hottest ? The coldest ?
(Ideas 1 and 2 given by Erik )
All ideas presented here are not necessarily supported by the current version of the measure activity.
Downloading and running the activity on the XO
git-clone git://dev.laptop.org/projects/measure/ ./Measure.activity
This would download the activity code in a folder Measure.activity which you should copy to /usr/share/activities/ folder on your XO .
If you are using sugar-jhbuild emulation, then you should copy it to <sugar-jhbuild>/build/share/activities/ folder where <sugar-jhbuild> is the path of the sugar-jhbuild folder on your machine (PC).
Activity has been found running well on builds 490 and higher
Technical details
The microphone jack doubles up as an Analog Input port. --to do --
Ideas for the future
--to do--
For developers
--code design explanation--
Software task list
1. Check all settings of Alsamixer at startup and shutdown of activity. Make kernel patch.
2. Find appropriate smoothing algorithm
3. Include header in log file , also include all relevant information - scale, interval etc.
4. Explore a scrolled window for graph of logged data
5. Set spacing interval when drawing from file
6. Explore pylab/matplotlib as an alternate rendering option or maybe just for the plot from log part
7. Calculate and display Fourier transform, add a button in UI
8. Work on optimizing the display, esp the background display method
9. Incorporate sharing wherein shared waveform would be drawn with a separate color. Basically self.buffers list is required to be shared
10. Calculate scale on different ranges and display it along other details in "Show Details"
11. Scale RMS, AVG and Pk Pk display values to correspond the voltage values.
12. Installation of NumPy and related dependancies on XO
Some Links
--to do --
WARNING : Do not measure the mains voltage, it would destroy your XO
Contact
arjun@laptop.org
--Arjs 00:49, 21 July 2007 (EDT)
