Wireless Management Traffic
Overview
Wireless medium is a scarce resource. Current data rates commercially available are not only some orders of magnitude slower than those of wired networks but also, to make things worse, the inherently shared medium, particularly on the unlicensed portions of the spectrum, may exhaust airtime availability easily.
For any wireless network to scale it is fundamental to make the best use of the spectrum. Even considering that the XOs primary target are regions where contention or interference from other sources are not as strong as what we would find in the urban developed regions of the world, its mesh network will have to make good use of the airtime in order to scale to many tens of nodes.
In this page we will describe the tests, analysis and adjustments that were performed in order to limit the impact of a specific category of traffic, namely the management frames that convey link layer presence and capabilities information: Beacons and Probe Requests/Reponses.
As the airtime analysis is obviously very important in the study of wireless networks, an airtime tool was developed and can be downloaded here. The instructions and basic math behind the tool, can be found here.
Beacon Backoff
The first analysis on this item was related to the aggregated traffic generated by a group of XOs beaconing. Since the default frequency in which an XO broadcasts beacons is 10Hz, it is easy to see that this traffic could exhaust airtime in a dense mesh if no counter measure was introduced.
XO’s Beacons typical size is 114 bytes. Since they are transmitted at 1 Mbps, this means that each one of them consumes 1.104 ms or airtime. 30 XO’s would, thus, suffice to take about one third of the available airtime.
To avoid this, XOs implement a backoff mechanism that reduces the number of beacons one node will transmit in response of the number of beacons it can hear from other nodes. Figure 1 shows that the backoff mechanism effectively avoids a beacon storm. In this experiment the number of beacons sent by one XO was 8.8 per second., while with ten XOs this number raised to only 11.8. The fact that only 8.8 beacons per second were captured, while we would expect to see 10 beacons per second, can be explained by the fact that the traffic was captured by a monitoring station, that can fail to capture all the traffic and also because some of beacons might have collided. Finally the frequency may fluctuate because of the backoff mechanism itself – nodes will send beacons according to what they hear – or because of the buffer conditions on the node.
figure 1 - The aggregated frequency of beacons for a mesh cloud starting with one and growing to 10 nodes.
It was observed that in an environment with more than 50 active XOs, the aggregated beacon traffic was inferior to 20Hz and although the backoff mechanism was proved effective, and might suffice to avoid a spectrum meltdown, another control was added that can reduce or even disable beacon traffic. This control is implemented in the form of a private ioctl and can be accessed via the iwpriv command:
iwpriv msh0 bcn_control 0|1 <interval>
The default interval is 100ms (10Hz) and values from 20ms (50Hz) to 1 second (1Hz) are accepted. With this new feature the test described above was repeated. All ten nodes were configured to the new frequency of beacons and the aggregated traffic varied from 55Hz (1 node) to 57Hz (10 nodes).
In fact there is no reason to raise the beacon frequency and with current default value of 10Hz (which can be lowered or even disabled) 10 XOs would consume 1% of the airtime. Beacons are currently only used to maintain the ad-hoc mode compatibility. We conclude that we can reduce the frequency of beacons to one second and free about 0.9% of airtime and we also conclude that there is no risk of beacons clogging a mesh clouds of any feasible size (a mesh cloud with hundreds of nodes is not foreseen at present).
Probe Requests/Probe Responses
XOs periodically send out Probe Requests and respond to each others Probe Requests with Probe Responses. Contrary to the Beacons, there is no backoff mechanism and Probe traffic can harm network performance.
What makes Probes traffic problematic is not the frequency probe requests are transmitted – about 0.1 Hz – but the burstiness of the traffic it generates. This can be particularly serious in dense mesh clouds where each single probe requests will trigger N near simultaneous Probe Responses.
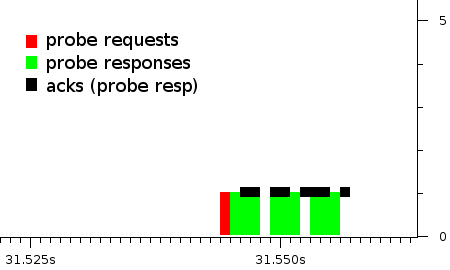
In a ten nodes network, one Probe Request and its nine Probe Responses will generate a traffic pattern like the one depicted in Figure 2. As we can see in this real and typical traffic capture, there is a high contention window that will last for about 12 milliseconds, during this significantly long time, data frames will have little chance of being successfully transmitted.
figure 2 - a bust of probe responses (and respective acks) triggered by a single probe request in a ten nodes mesh cloud. Captured by a monitoring tool
Differently from Probe Requests, which are broadcast frames, Probe Responses are unicast transmissions that will be repeated in case the destination (the node that originated the Probe Request) does not acknowledge the reception.
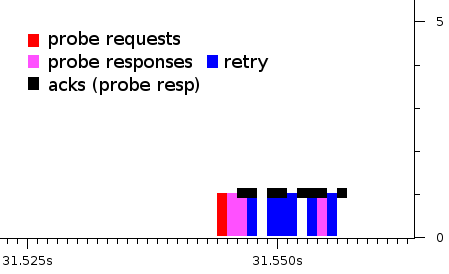
Because of the near simultaneous transmissions of Probe Responses, they will face a high level of collisions and subsequent retransmissions. It was obvious, from the very beginning of this investigation, that a mechanism to reduce Probe traffic should be implemented. Figure 3 shows the same probe response burst depicted in Figure 2, this time marking the retried transmission.
To address the probe burst another iwpriv control was added that allowed setting the number of retries a node should use specifically for the probe responses:
iwpriv msh0 setprepretrylt <0|15>
figure 3 - same as figure 2 but marking retries (in blue). Six out of the nine probe responses captured were marked as retransmissions.
The control over the probe responses helped reduce the management traffic, but the most interesting outcome of this experiment was the perception that a mechanism to mitigate the harmful effects of bursts was necessary.
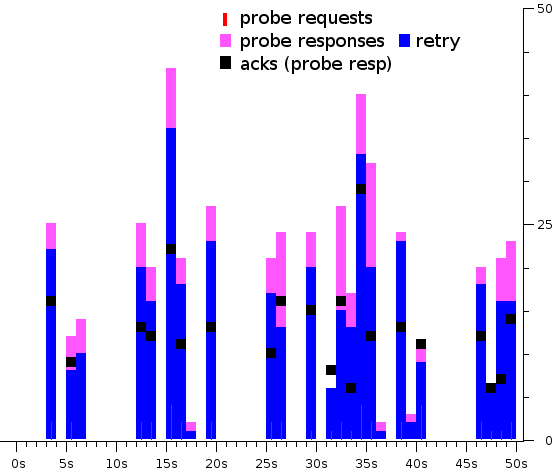
The number of retransmissions that could be observed throughout the experiment account to 76% of all probe responses as shown in Figure 4, and can be expected to happen to all traffic that present a similar pattern, i.e. occurs in bursts, and a counter measure to improve this – an adaptive contention window – will be described in Analysis #3.
figure 4 - The number of retries in probe responses transmissions can reach 76% even in an idle network. For this graph, the consolidation interval is 1 second.


