Ejabberd resource tests/try 2
Jump to navigation
Jump to search
Second try: 3200 accounts, multiple clients
I ran hyperactivity on several machines to get the following results.
# Tested with 3200 users and 15 second intervals from 3 clients (2 XOs
# 50 each; toshiba laptop - up to 275).
#
# Clients  secs     mem       load avg     client OK     server OK

  100      15       119        0.12         True          True
  150      15       129        0.16         True          True
  175      15       145        0.38         True          True
  200      15       151        0.25         True          True
  225      15       166        0.31         True          True
  250      15       172        0.40         True          True
  275      15       179        0.43         True          True
  300      15       189        0.43         True          True
  325      15       194        0.51         True          True
  350      15       200        0.67         True          True
  375      15       206        0.60         False         True

#Starting 200 users from xs-devel (martin's dell core2 duo laptop)
# then adding 2  XOs with 50 each
# then steps of 25 from the toshiba

  200      15       167        0.20         True          True
  300      15       182        0.20         True          True
  375      15       211        0.80         True          True
  400      15       222        0.77         True          True

#adding another XO
# web interface is very slow to report these connections,
# getting stuck first on 427

  427      15      253         0.86         True          True

# stop all but 1 XO (now dell 200, toshiba 100, XO 50).
  350      15      234         0.56         True          True

#restart 3 XOs, 1 at a time

 400       15      232         0.88         True          True
 450       15      240         0.96         True          True
 500       15      104         1.02         True          False

# web interface dies at 500-15.  mem drops to 89.
# sharing works for new connections
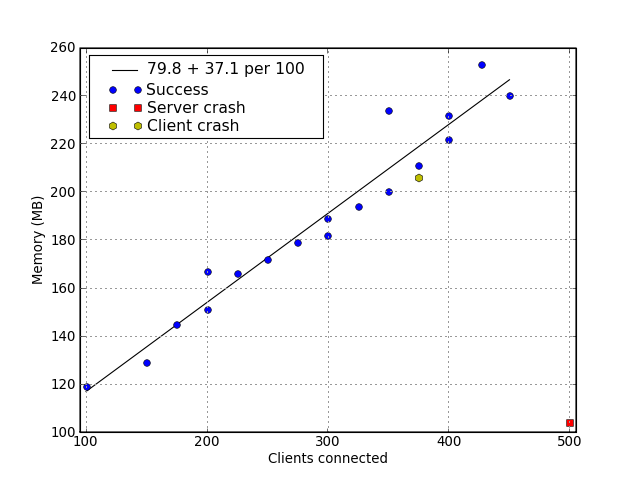
However I tried it, ejabberd would always crash with around 500 connections. It turns out this was due to a system limit on the number of open files, which can be raised by editing /etc/security/limits.conf (see the next section).
This shows that memory usage is fairly well predicted as 80 MB + 37MB per 100 active clients. That would mean an ejabberd instance with 3000 active clients needs about 1200MB.
The load average jumps around a bit, but definitely goes up as clients are added.
