Mppt: Difference between revisions
No edit summary |
|||
| Line 7: | Line 7: | ||
The voltage output of a PV panel is related to its ouptut current. The VI curve for the OLPC panel looks like this. This is typical for almost all PV panels. |
The voltage output of a PV panel is related to its ouptut current. The VI curve for the OLPC panel looks like this. This is typical for almost all PV panels. |
||
Image:10w_iv.png|10W IV |
|||
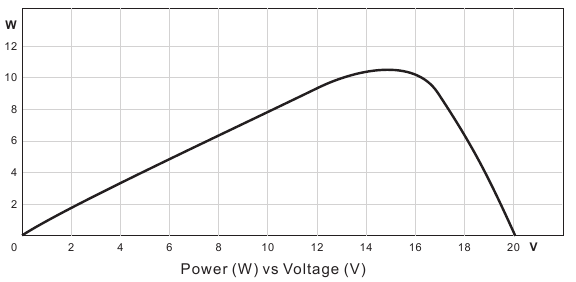
As the current draw increases from the panel the voltage decreases. This creates a power curve that looks like this |
As the current draw increases from the panel the voltage decreases. This creates a power curve that looks like this |
||
Revision as of 19:56, 17 March 2011
EC MPPT algorithm
Overview
This describes the MPPT algorithm present in the XO-1.5 embedded controller. When operating from a PV solar panel the available power can be very dynamic even in seeming very sunny conditions. In many cases the maximum power available from the solar panel is less than the maximum power draw of the XO-1.5. The maximum power input to the XO-1.5 is 25W but the most common OLPC solar panel in use is only rated at 10W. This can create up to a 15W power deficit.
The voltage output of a PV panel is related to its ouptut current. The VI curve for the OLPC panel looks like this. This is typical for almost all PV panels.
Image:10w_iv.png|10W IV
As the current draw increases from the panel the voltage decreases. This creates a power curve that looks like this
So the the maximum power point of a PV panel is obtained when you maximize both the voltage and the current.
Definitions
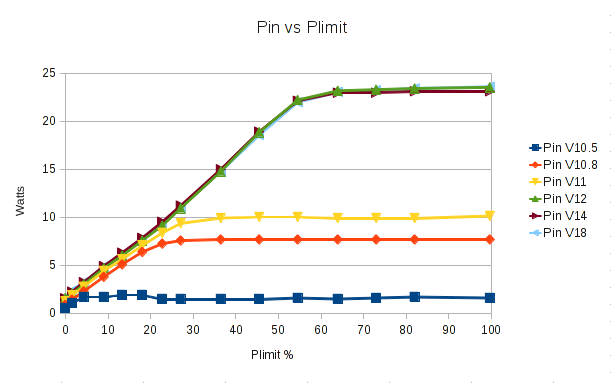
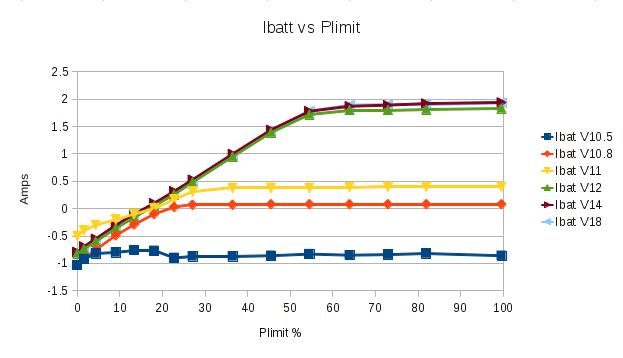
Pin : Power input to the XO. Psystem : Ammount of average input power that results in a average battery current of zero or very near zero. Its been eperically determined on a 1.5 to be about 7W average if the system is doing work. Plimit : The charger power limit % the corresponds to Psystem. Emperically determined to be 20%
Psystem and Plimt Data
Squeal Detect
Squeal Detect is the ability of the EC to detect when the system is attempting to draw much more current than the PV source can provide. When this happens the external power good pin can start to oscillate. It usually oscillates in the audible range and the inrush currents into the inductions produce an audible "squeal". The squeal detector watches this pin and indicates when its oscillating.
Assumptions
TODO:
Flow Chart
Wikimedia seems to hate trying to render my .svg . Here's a link to the .svg file Media: mppt.svg
The dia file is also available.
And here's the same thing as pdf:


