Simple mesh test (Cerebro): Difference between revisions
m (Cerebro test plan moved to Simple mesh test (Cerebro)) |
|||
| (2 intermediate revisions by the same user not shown) | |||
| Line 22: | Line 22: | ||
== Results == |
== Results == |
||
===Discovery and profile information=== |
===Discovery and profile information=== |
||
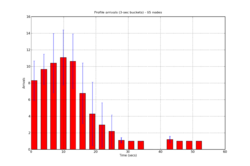
[[media:65-arr-1.png|'''This''']] graph shows arrival of profile information at each XO from other XOs a function of time. Each bar is a 3-second bucket representing the average number of profile arrivals during this 3-second period. The standard deviation is shown with the blue lines. |
|||
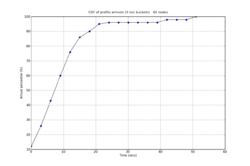
[[media:65-cdf-1.png|'''This''']] graph is the cumulative distribution function. It shows that, on average, each XO has received about 95% of the profiles of the rest of the nodes within just 20 seconds. This performance boost is due to the fact that each XO queried for its profile, responds by broadcasting the profile, instead of unicasting it to the requester. As a result, the other nodes receive the profile too and the next node is queried, yielding a linear cost, instead of a quadratic one. |
|||
===Bandwidth usage=== |
===Bandwidth usage=== |
||
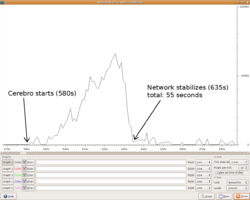
[[media:Bandwidth-presence-info-1.png|'''This''']] wireshark snapshot shows bandwidth usage that peaks momentarily at about 60kbytes/sec. The snapshot is also in accordance with the first graph above, showing that after about 55 seconds the network stabilizes. After the network stabilizes, bandwidth usage drops to 1 packet every 3 seconds (less than 500bytes/sec), as the arrival rate adapts to the density of the network. |
|||
===Chat session=== |
===Chat session=== |
||
Before the experiment was started, a node shared a chat session and all 64 nodes joined consistently. I sent a few chat messages from a couple of XOs and were received on all other XOs. |
Before the experiment was started, a node shared a chat session and all 64 nodes joined consistently. I sent a few chat messages from a couple of XOs and were received on all other XOs. |
||
== Other notes == |
== Other notes == |
||
Latest revision as of 00:01, 11 May 2008
Here are the latest results from Cerebro's (http://cerebro.mit.edu) scaling properties. A 65-node testbed was used (703, Q2D14). The NetworkManager had to be disabled in order to stabilize the behavior of each XO's wireless interface. Unfortunately, the difficulty and time necessary to manage increasingly more nodes is linear (given that the NetoworkManager is disabled ;-), but increases steeply.
Test plan
Cerebro was started on all 65 laptops almost at the same time. We attempted to emulate the "65 children turn on their laptops in class at the same time" scenario. With Yani's help, it took about 5 seconds for both of us to press 'enter' on all laptops. Each XO would discover each other, exchange profile information and keep exchanging presence/discovery information.
Measurements
Quantitative
According to the protocol, presence (mac address) arrives about other XOs first, then the profile for the newly arrived mac address is queried and finally the profile is cached. We assume that initially each XO has no cached information about other XOs. As a result, every XO will query everyone else.
We measured the time it took for each XO to discover and exchange profile information with everyone else, bandwidth usage at all times (during profile exchange and after the network stabilized when all profiles were received everywhere)
Qualitative
Collaboration was tested on all 65 nodes: one shared a chat session, everyone else joined. The chat session was based on Cerebro's collaboration model.
Results
Discovery and profile information
This graph shows arrival of profile information at each XO from other XOs a function of time. Each bar is a 3-second bucket representing the average number of profile arrivals during this 3-second period. The standard deviation is shown with the blue lines.
This graph is the cumulative distribution function. It shows that, on average, each XO has received about 95% of the profiles of the rest of the nodes within just 20 seconds. This performance boost is due to the fact that each XO queried for its profile, responds by broadcasting the profile, instead of unicasting it to the requester. As a result, the other nodes receive the profile too and the next node is queried, yielding a linear cost, instead of a quadratic one.
Bandwidth usage
This wireshark snapshot shows bandwidth usage that peaks momentarily at about 60kbytes/sec. The snapshot is also in accordance with the first graph above, showing that after about 55 seconds the network stabilizes. After the network stabilizes, bandwidth usage drops to 1 packet every 3 seconds (less than 500bytes/sec), as the arrival rate adapts to the density of the network.
Chat session
Before the experiment was started, a node shared a chat session and all 64 nodes joined consistently. I sent a few chat messages from a couple of XOs and were received on all other XOs.
Other notes
After about 6.4 hours of continuous operation on all 65 nodes, Cerebro shows stable memory usage (<10MB) and consistent CPU usage (83 minutes of CPU usage in 'top').
Previous test and results
So far, Cerebro has been tested on up to 27 XOs. Here are some preliminary test results Experimental results.


