XO 1.5 A2 Tinderbox: Difference between revisions
| Line 11: | Line 11: | ||
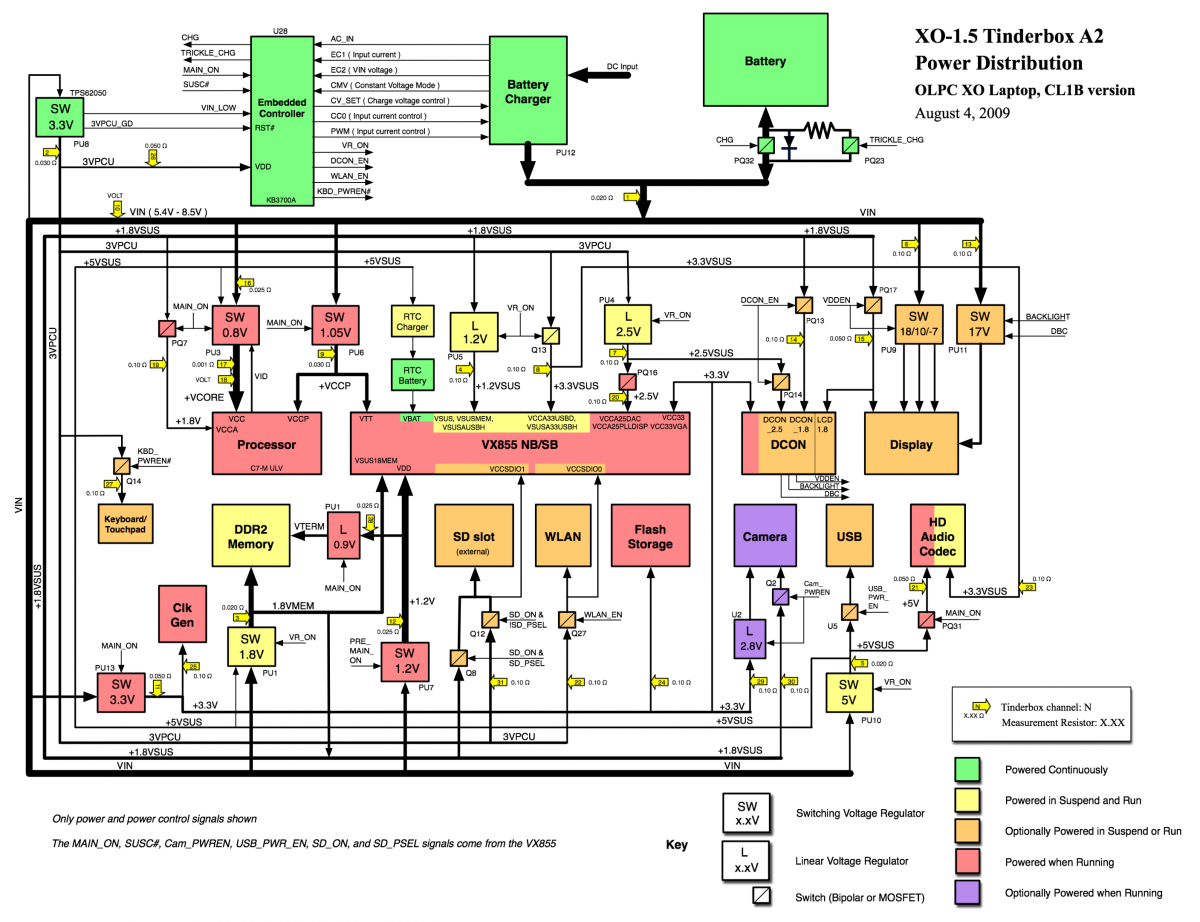
This is the power distribution diagram for an [[XO_1.5_A2|XO 1.5 A2 prototype]]. It shows the different locations where we are measuring power consumptions (through current measurements). We also measure a couple of voltages (Vin and Vcore), as they vary over time and are needed to make power calculations. |
This is the power distribution diagram for an [[XO_1.5_A2|XO 1.5 A2 prototype]]. It shows the different locations where we are measuring power consumptions (through current measurements). We also measure a couple of voltages (Vin and Vcore), as they vary over time and are needed to make power calculations. |
||
[[Image:XO_1.5_A2_Tinderbox.png| |
[[Image:XO_1.5_A2_Tinderbox.png|1200px]] |
||
A [[Media:XO_1.5_A2_Tinderbox.pdf|printable PDF version]] is also available. |
A [[Media:XO_1.5_A2_Tinderbox.pdf|printable PDF version]] is also available. |
||
Latest revision as of 04:57, 10 August 2009
This describes the power testing setup for early prototypes of the XO-1.5 motherboard.
Overview
As part of the software development and device testing process for the XO laptops, they are connected to a testbed (the Tinderbox) for exhaustive power measurement while running different software suites. This includes a networked multi-channel high-precision voltmeter, used to measure current draws around the system.
We currently have an XO 1.5 A2 prototype wired up for testing.
Particulars
This is the power distribution diagram for an XO 1.5 A2 prototype. It shows the different locations where we are measuring power consumptions (through current measurements). We also measure a couple of voltages (Vin and Vcore), as they vary over time and are needed to make power calculations.
A printable PDF version is also available.
A script is provided which reads the power consumption and offers a summary.
Results
Some results are in http://dev.laptop.org/~wad/xo1.5pwr/.
