Measure/Start
Getting Started with Measure
The software
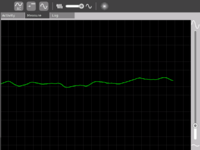
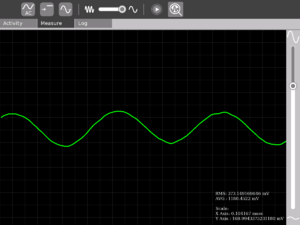
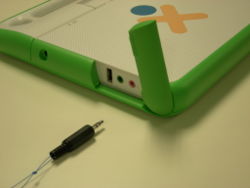
Input:One can connect sensors/give input voltage through the pink Mic jack on the left side of the display screen. When nothing is connected there, the default signal is the sound signal from the built in Mic on the XO. Graph: The green moving line on the screen indicates the signal
Grid and background: The light grey lines that form a criss cross grid allow one to estimate the values of the signal at different instants of time. To get a value, multiply the Scale value for either the X Axis or the Y Axis (shown when one clicks on the "Show values" button in the Measure Toolbar) by the number of divisions of the grid in the X direction (horizontal) or Y direction (vertical).
Slider on the right: The slider on the right controls the magnification (gain) of the waveform. Move it up if the waveform that you see is too small and move it down is the waveform is going out of the screen.
Measure Toolbar: Use this to view and modify the signal.
- AC/DC button -- This button selects whether you want to give a DC input or an AC input. Batteries, light sensors and temperature sensors have DC input. The microphone has an AC input.
- Bias control button -- Some sensors would require this ON to work properly, most of the times you wouldn't need to touch this button. The built in mic requires this to be OFF.
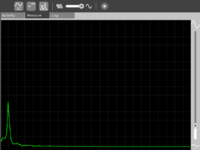
- Time/frequency button -- This button changes the X Axis from time-based to frequency-based, allowing one to view the signal representation or a real time representation of the signal. Selecting this option is most fun when one is whistling into the microphone. This wouldn't be of much use when connecting external sensors.
- Slider -- Move it to the position that allows you to best view the waveform. This slider controls the frequency range.
- Show details -- Press this button when you want to see statistical data about the signal. The scales are shown in this option - the X axis scale and the Y axis scale.
Log Toolbar: Use this when you want to record data
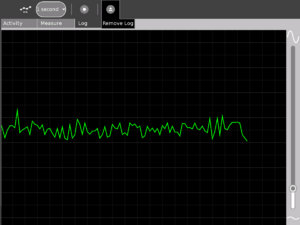
Snapshot/1 second/1 minute/1 hour -- Select the way you want to record data. Snapshot means taking a picture of the current waveform that you see on the screen. 1 second/1 minute/1 hour selects at what interval one can record data.
Show saved data -- Shows you the saved waveform. Press it again to remove the display of the saved waveform.
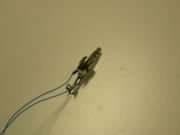
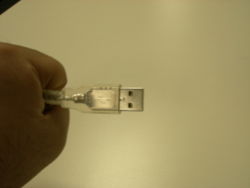
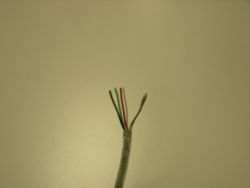
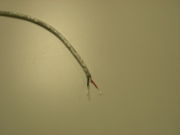
How to connect sensors (How to build a sensor-probe)
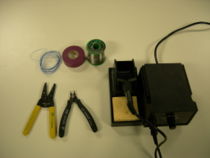
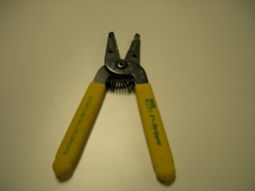
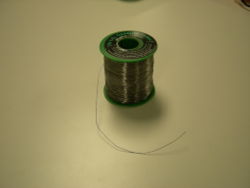
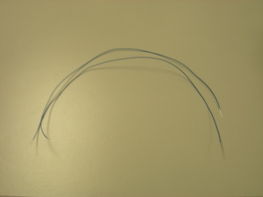
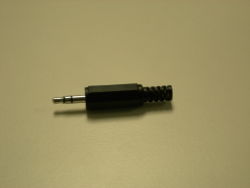
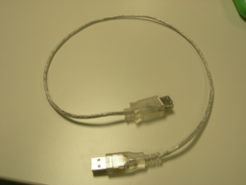
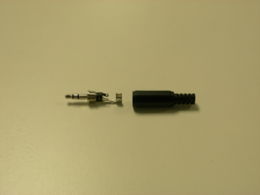
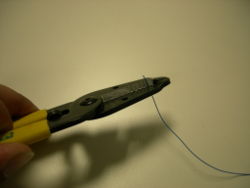
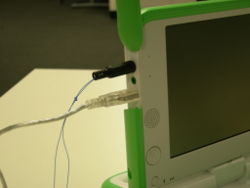
This section details outlines steps to build a low cost probe for connecting sensors to the XO for Measure
To summarize, do remember that we have identified three terminals
- The "Vin" terminal
- The "+ve" terminal
- The "Gnd" terminal (the Gnd of audio connector is connected to Gnd of USB connector"
